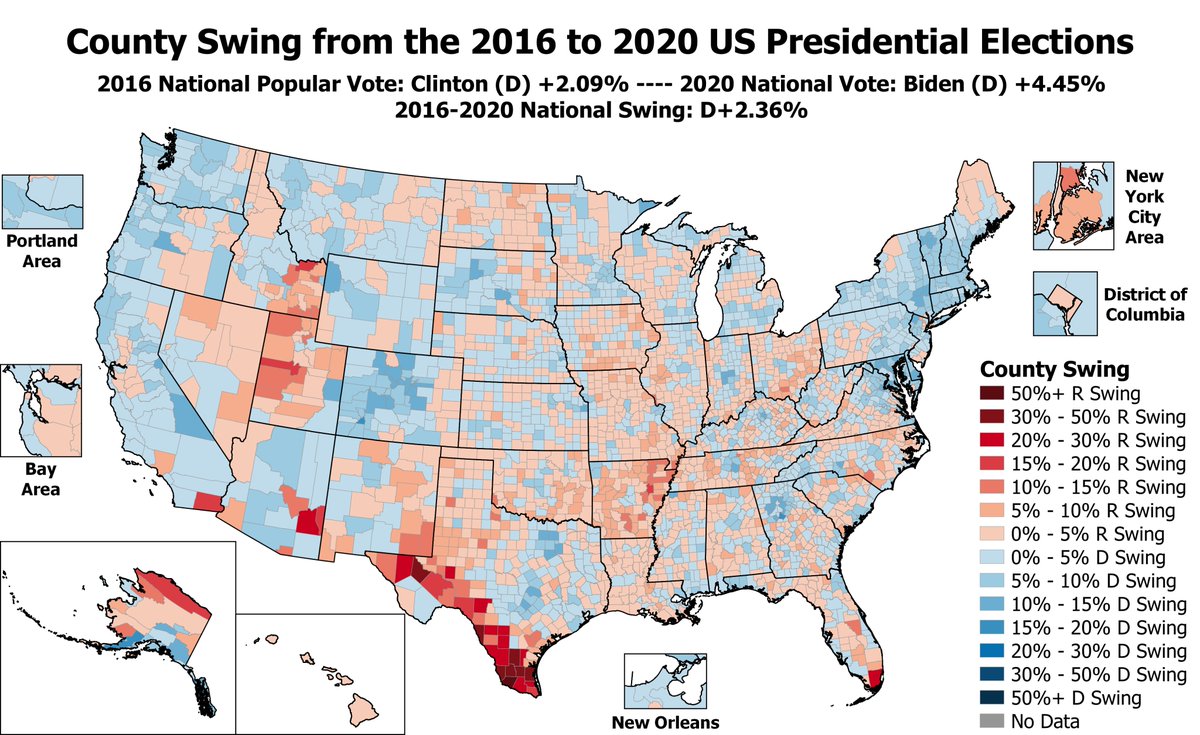
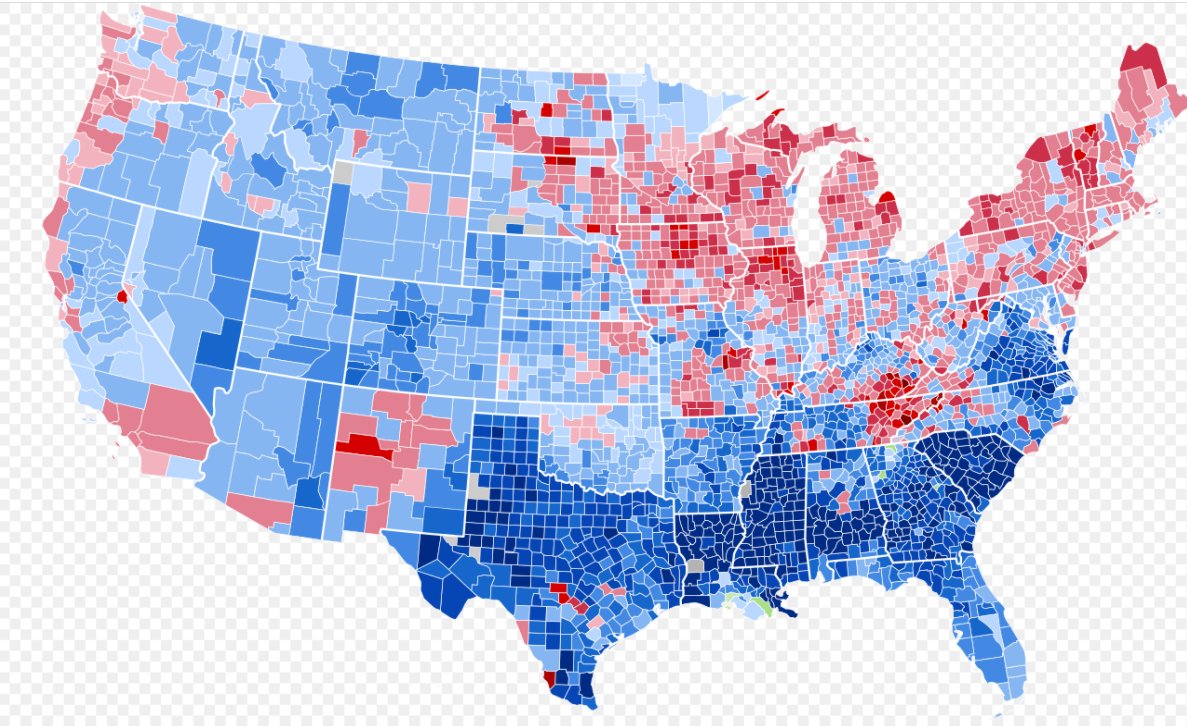
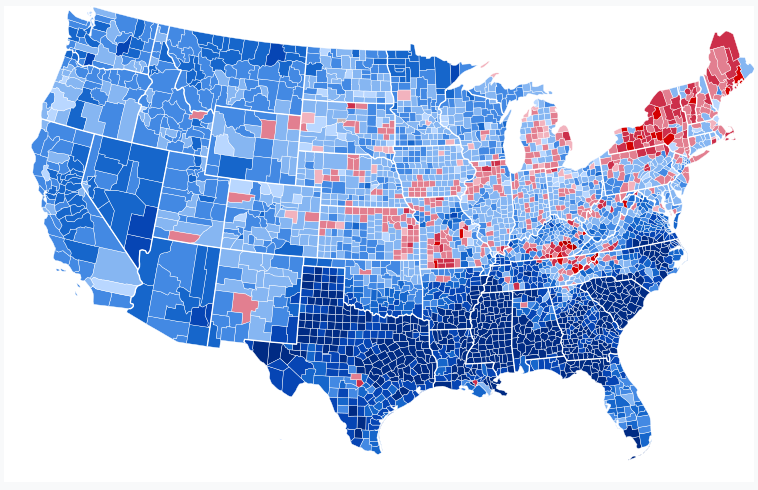
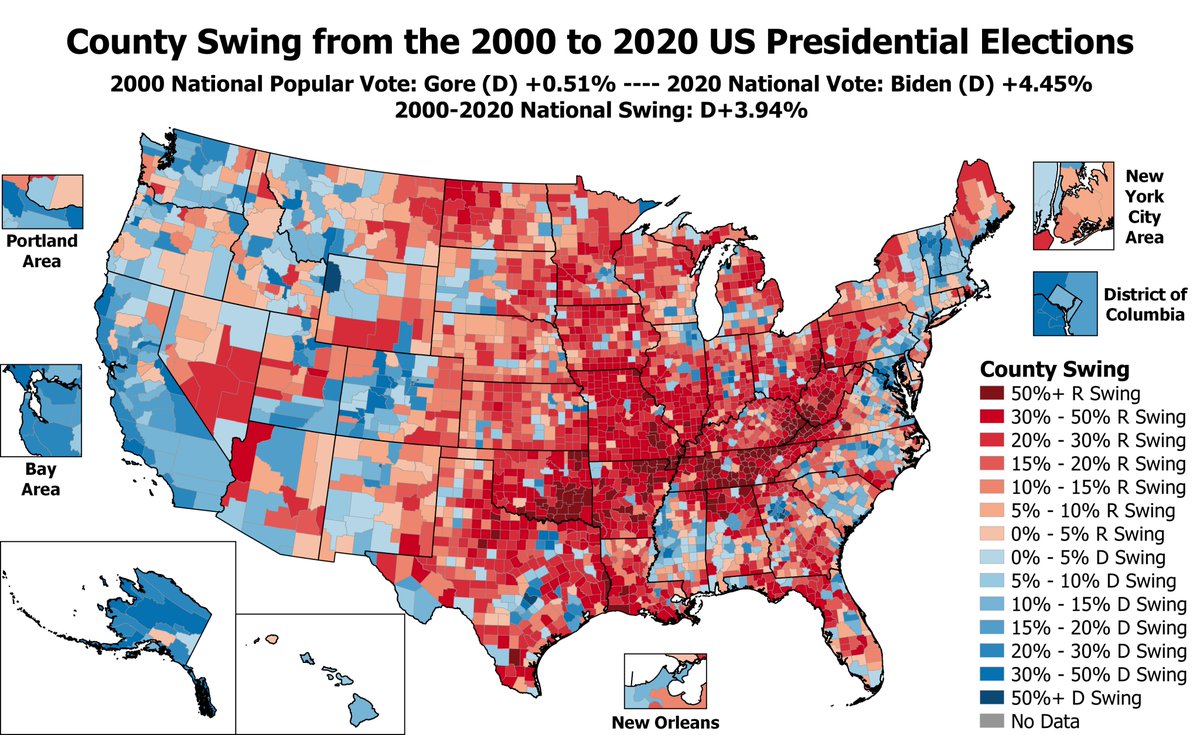
Swing from the 2000 to 2020 US Presidential Elections, suggested by @SpecialPuppy1. Biden did ~4 pts better than Gore nationwide. The rural/urban divide grew over the past 20 years, tho Biden improved in a few rural areas of the West/South/NE, & Trump did better than Bush in NYC:
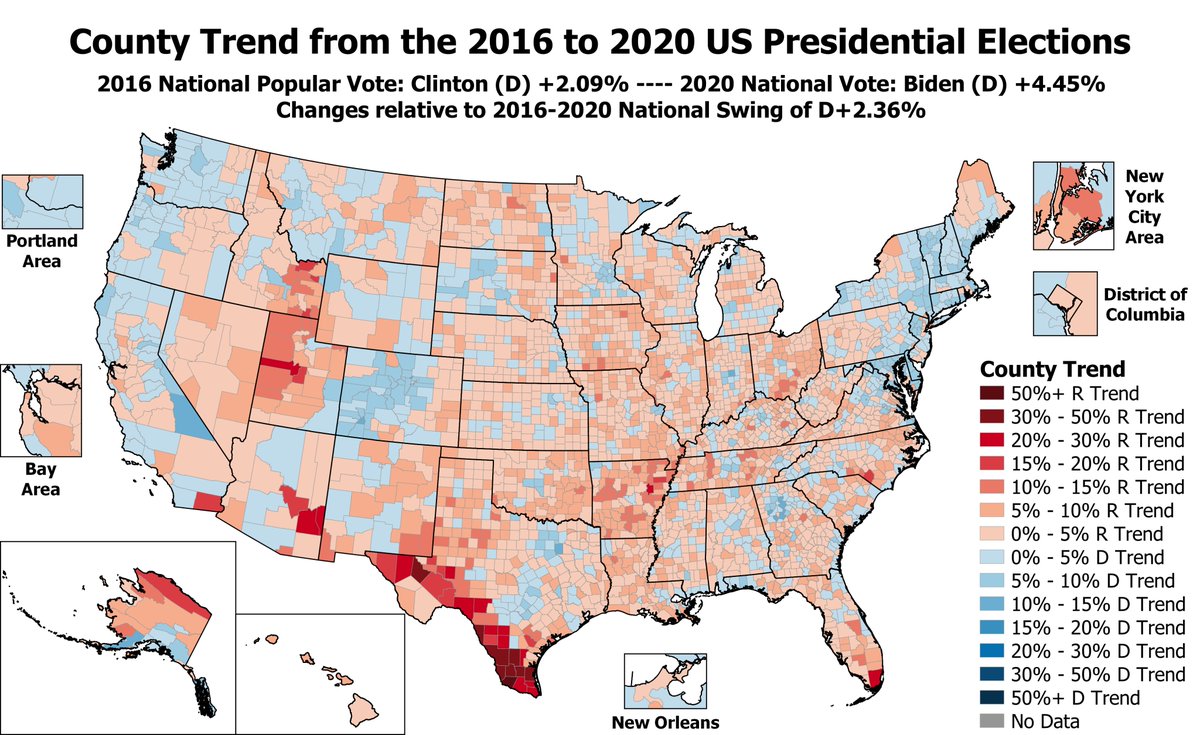
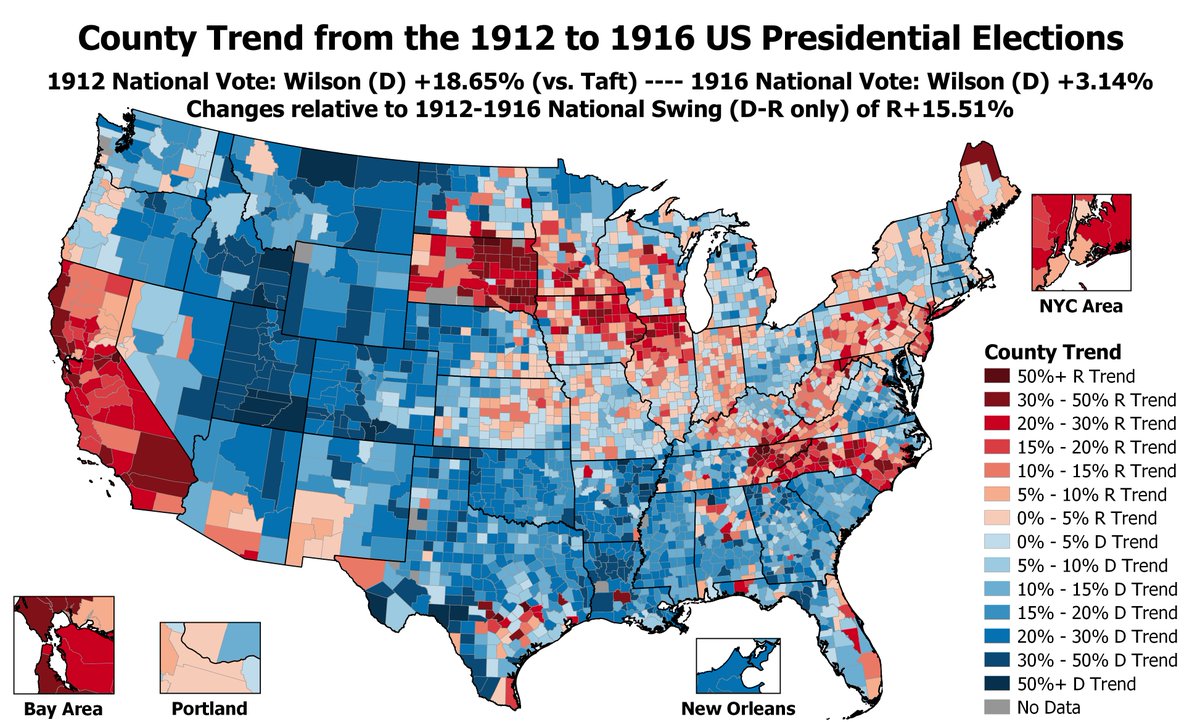
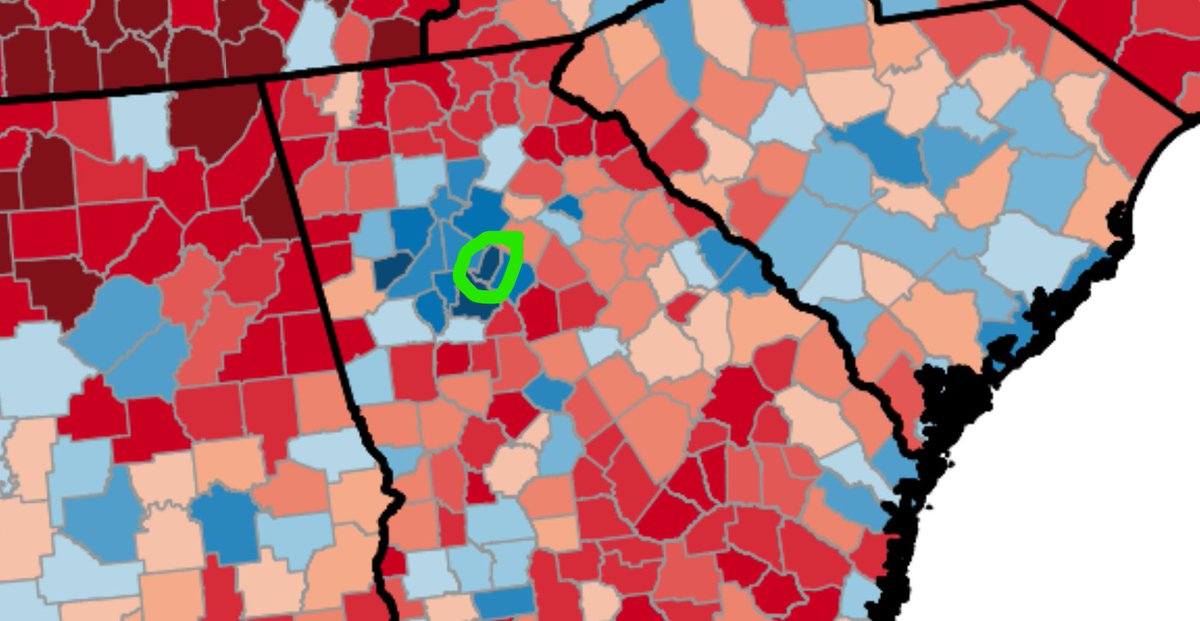
Here is the same map in "Trend" form, so county changes are RELATIVE to the 4 pt Democratic swing nationally from 2000-2020. The areas trending towards Democrats since 2000 tend to be larger in population. For example, Biden was able to flip GA while most GA counties trended GOP:
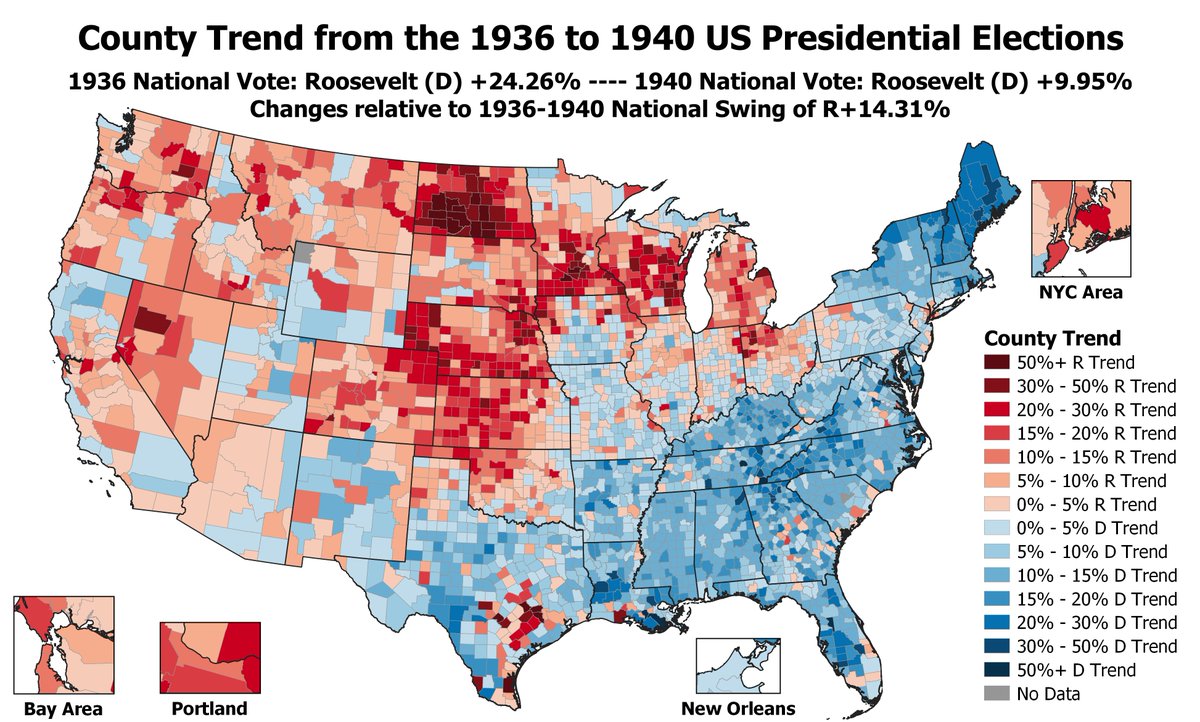
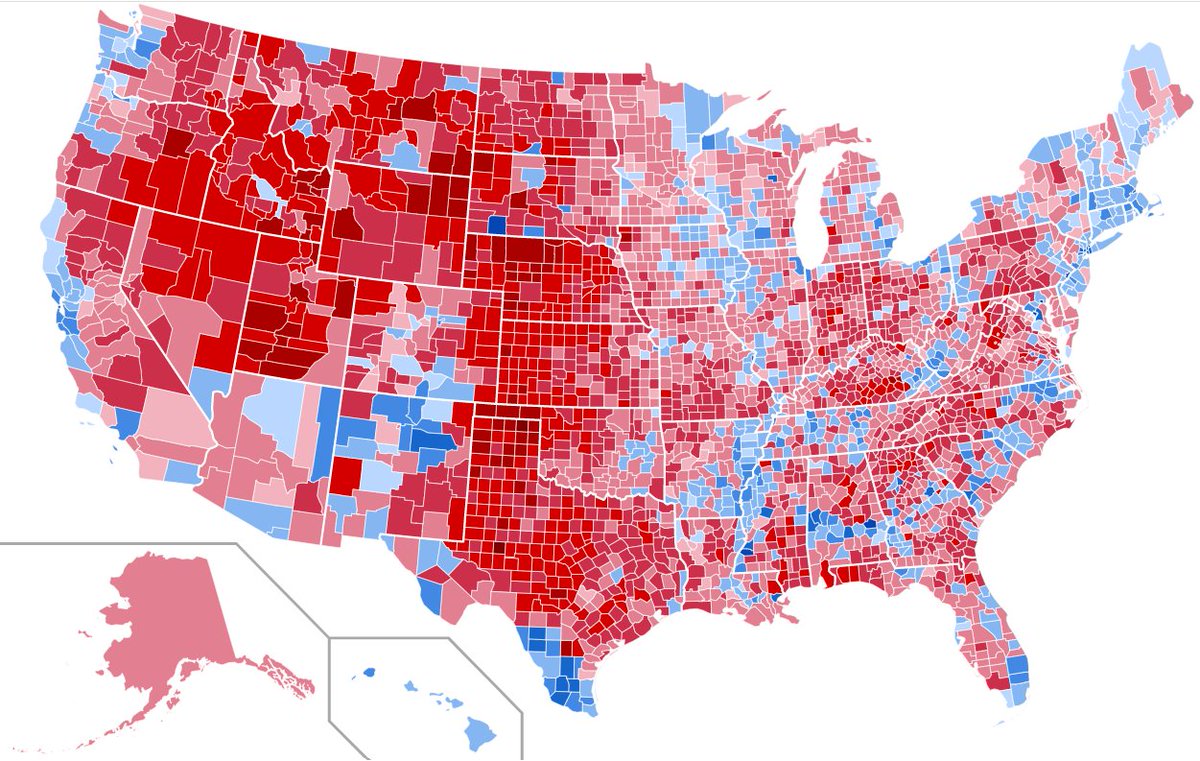
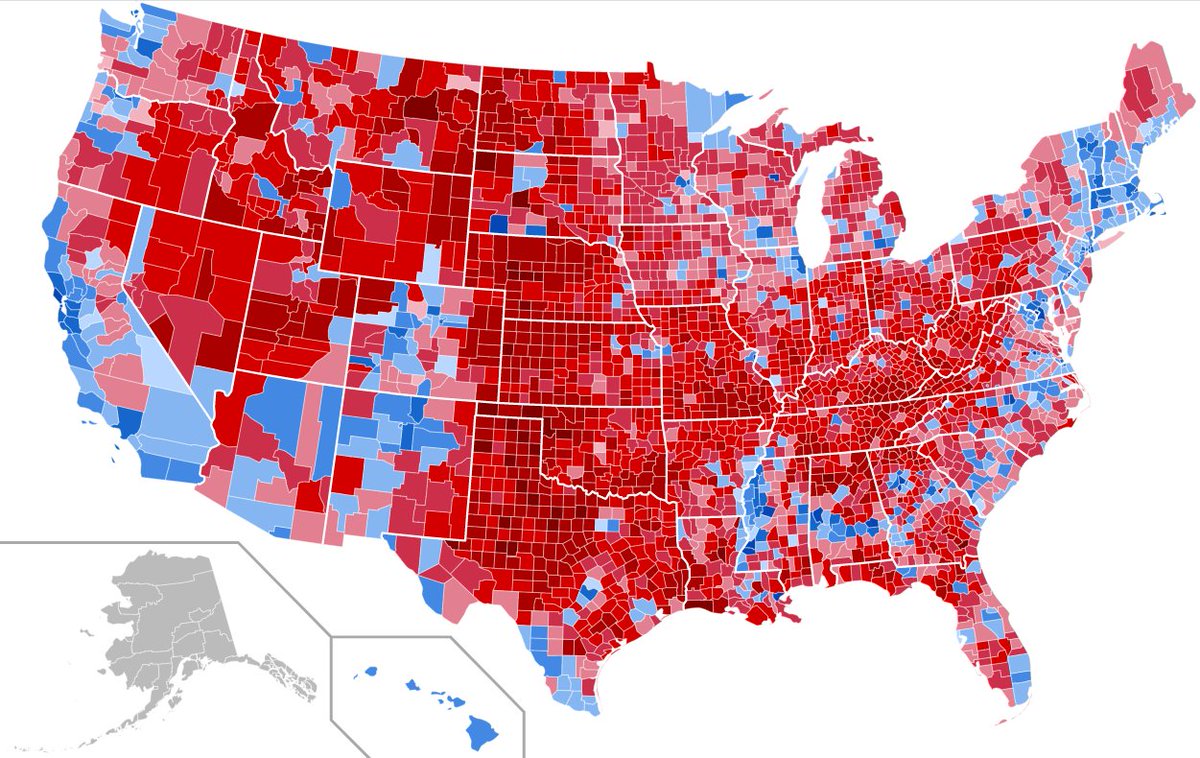
Here are the actual county maps from 2000 & 2020, from Wikipedia. In 2000 Gore was still able to hold onto some ancestrally Democratic Southern White counties (especially in his home state of TN & in nearby AR) but by 2020 these were gone, tho Biden flipped many suburban counties
The biggest Democratic swing from 2000-2020 was in Rockdale County GA in the Atlanta suburbs, which went from 63-34 Bush in 2000 to 70-29 Biden in 2020, a 70 pt swing in margin! Rockdale was only 18% African-American in the 2000 census but is now an estimated 51% African-American
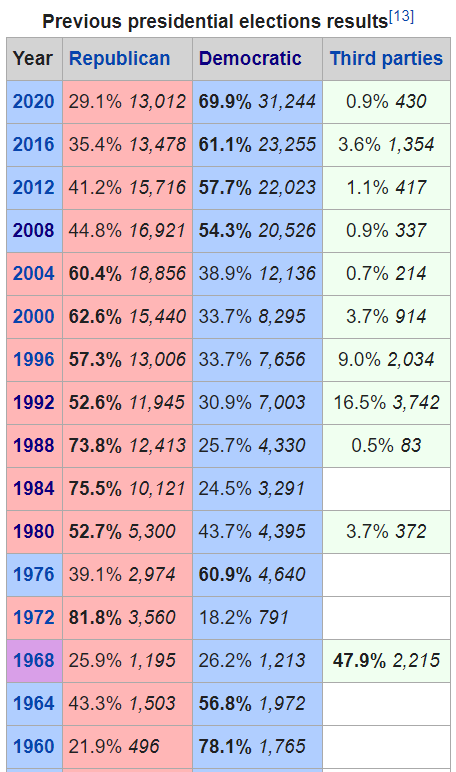
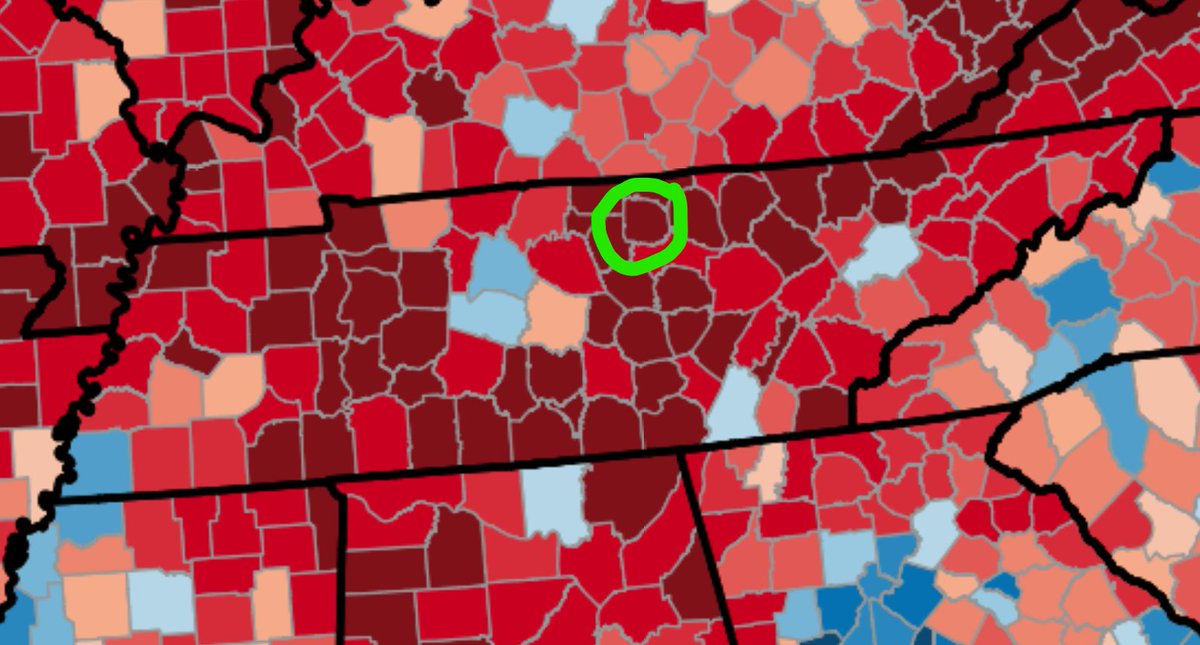
The biggest GOP swing was in Jackson County TN, which voted 70-29 for favorite son Al Gore over George W Bush in 2000, but flipped to 77-21 for Trump over Biden in 2020, a 96 pt swing! Jackson County TN is 95.9% White, much higher % than the state of TN which is only 74.5% White.

• • •

Missing some Tweet in this thread? You can try to force a refresh
 

Keep Current with Mill✨🤝

Mill✨🤝 Profile picture

Stay in touch and get notified when new unrolls are available from this author!

Read all threads

This Thread may be Removed Anytime!

PDF

Twitter may remove this content at anytime! Save it as PDF for later use!

Try unrolling a thread yourself!

how to unroll video
  1. Follow @ThreadReaderApp to mention us!

  2. From a Twitter thread mention us with a keyword "unroll"
@threadreaderapp unroll

Practice here first or read more on our help page!

More from @Millenarian22

21 Dec
Many people have already made this map, but I felt I had to make a 2016-2020 Swing map as well. Voting patterns were mostly stable, with 74% of counties having a swing of less than 5 pts towards either party from 2016. There were big shifts in areas like the RGV & Atlanta Suburbs
The national popular vote shifted 2.4 pts towards the Democrats (from Clinton +2.1 to Biden +4.5). If we map county changes RELATIVE to that national swing it flips many rural counties from blue to red, meaning that they swung Biden, but by less than the nation's 2.4 pt swing:
The biggest swing towards the Democrats may have been in Skagway Municipality, Alaska, which went from an estimated 53-28 Clinton in 2016 to 71-23 Biden in 2020, a 23 pt swing. However, these numbers are estimates, thanks to @cinyc9 who calculated them:
Read 6 tweets
29 Nov
Map of the 100 year swing from the 1920 to 2020 Presidential Elections. In 1920, Harding (R) won a 26 pt landslide, currently Biden (D) is winning by 4 pts, so nationally there was a 30 pt Dem swing over 100 years. GOP gained in most of the South, Dems on the WestCoast/Midwest/NE
Here is the same map in "Trend" form, so county changes are RELATIVE to the large 30 pt Democratic swing nationally. Most urban areas outside the South trended Dem over the past century, while most rural areas have trended GOP, with a few exceptions on the West Coast/Midwest/NE:
Here are the actual county maps from 1920 & 2020 (maps from Wikipedia). In 1920 almost all the counties won by Cox (D) were in the South, while in 2020 Biden won pockets/stretches of counties in all different regions of the country, with most rural counties going to Trump.
Read 6 tweets
28 Nov
Swing from the 1912 to 1916 elections. Woodrow Wilson (D) was elected in 1912 in a 4-way race, beating Taft (R) by 19 pts (only beat Teddy Roosevelt, who ran as a Progressive, by 14 pts, but this map is looking at the change in the D-R margin) then was re-elected in 1916 by 3 pts
Here is the same map in "trend" form, so changes are RELATIVE to the 15.5 pt swing towards the GOP in the national vote. The South & most of the West trended towards Wilson, tho in CA many voters who had went for TR in 1912 returned to the GOP in 1916, as did many Midwesterners:
Here are the actual 1912 & 1916 election by county. 1912 was very chaotic, with Roosevelt (Progressive, green) winning many counties & even a few counties being won by Eugene Debs (Socialist, orange). Most of the counties won by Roosevelt went back to the GOP & Hughes (R) in 1916
Read 5 tweets
27 Nov
Thread on the Exodusters, a group of African-American refugees who fled the end of Reconstruction in the South & moved to the "Promised Land" of Kansas in 1879 & 1880. They contributed to an increase in the African-American population of KS from 17,108 in 1870 to 43,107 in 1880:
Despite the increase of 25,999 African-Americans in KS, the % of the KS population that was African-American actually fell slightly, from 4.7% in 1870 to only 4.3% in 1880. This was because the White population of KS absolutely exploded, from 346,377 in 1870 to 952,155 in 1880!:
Many Exodusters migrated from Louisiana, where political violence was unbearable in the aftermath of the Compromise of 1877. Federal troops had been withdrawn, & paramilitary groups like the "White League" were attacking the Black population & suppressing the vote with impunity: Image
Read 9 tweets
8 Nov
#ElectionTwitter Thread: Map of the county swing from the 1936 to 1940 Presidential Elections. FDR was running for an unprecedented 3rd term & did 14.3 pts worse than in 1936, with big losses in heavily German-American areas like the Midwest & Great Plains, in the run-up to WW2:
Here's the same map in Trend form, so county swings are relative to the 14 pt national swing towards the GOP. Much of the NE & South trended towards FDR. Along with German-Americans, FDR had defections from some Italian & Irish voters, contributing to losses in urban areas (NYC):
Maps of the actual 1936 & 1940 elections from Wikipedia. GOP nominee Alf Landon had been blown out by FDR in 1936, only winning a smattering of counties across the country, but Wendell Wilkie was much more competitive in 1940, winning wide swathes of the rural heartland of the US
Read 11 tweets
7 Nov
Got lost in the shuffle a bit, but Trump ended up winning the single Electoral Vote from Maine's 2nd District pretty easily, by 7.9 pts! He won it by 10.3 pts in 2016, so Biden gained 2.4 pts. Maine as a whole went from a 2.9 pt Clinton win to a 10.1 pt Biden win, a 7.2 pt swing.
FiveThirtyEight had Biden actually favored to carry the district, with 7 of the last 8 polls favoring Biden, so this was one of the biggest misses of the cycle. Their overall Maine forecast wasn't far off though, projecting an 11.8 pt Biden win in Maine vs the actual 10.1 pt win.
On the other hand, FiveThirtyEight actually UNDERESTIMATED Biden in the 1st District of ME, thinking he would win by only 21 pts while he is currently leading by 22.7 pts. This pattern mirrors the nation: Biden was underestimated in blue areas like CA & overestimated in red areas
Read 4 tweets

Did Thread Reader help you today?

Support us! We are indie developers!


This site is made by just two indie developers on a laptop doing marketing, support and development! Read more about the story.

Become a Premium Member ($3/month or $30/year) and get exclusive features!

Become Premium

Too expensive? Make a small donation by buying us coffee ($5) or help with server cost ($10)

Donate via Paypal Become our Patreon

Thank you for your support!

Follow Us on Twitter!