Nenad Bakic Profile picture
26 Dec, 10 tweets, 5 min read
CEE countries: A case study in inevitability of SARS-CoV-2 spreading and seasonality - a THREAD

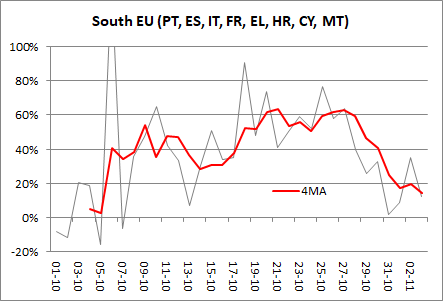
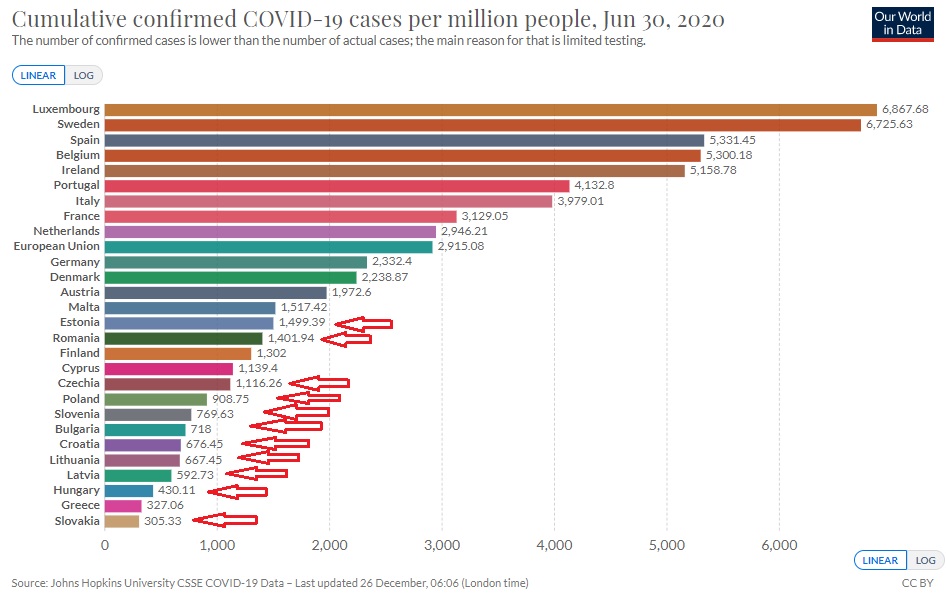
EU CEE countries did remarkably well in the 1st wave and were praised as champions. In red, and small Baltic countries in orange (we need to understand what's happening there)
1/
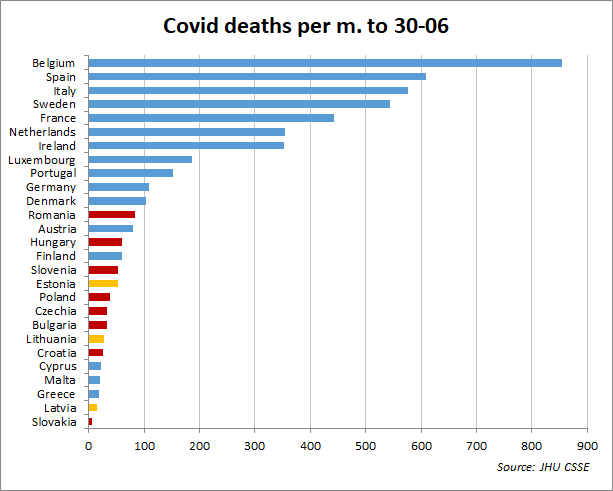
(... the analysis holds true with them, they are just marked with a different colour for clarity.)

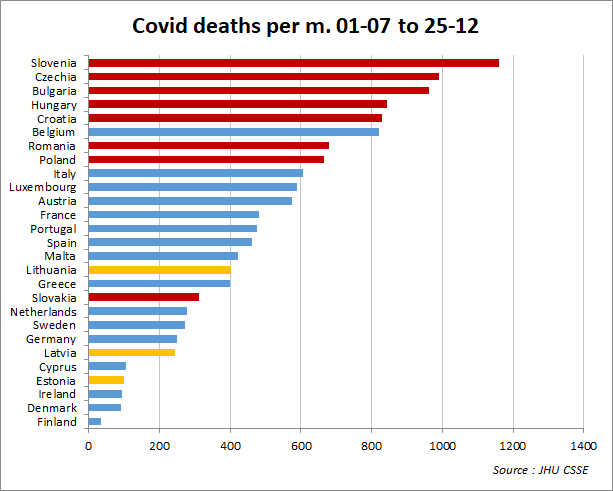
Only one of them was in Top 13 EU countries re. deaths. BUT, in the second wave, they dominate the list

2/
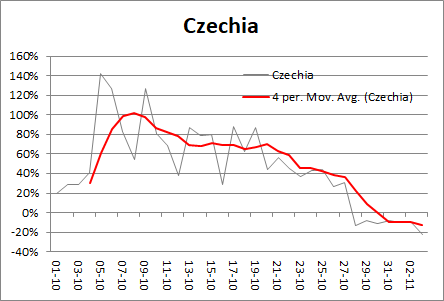
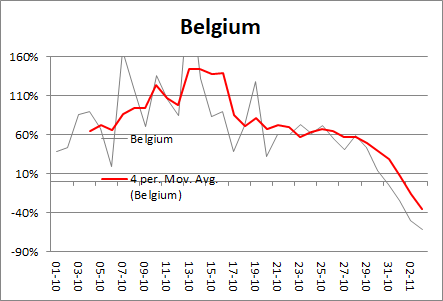
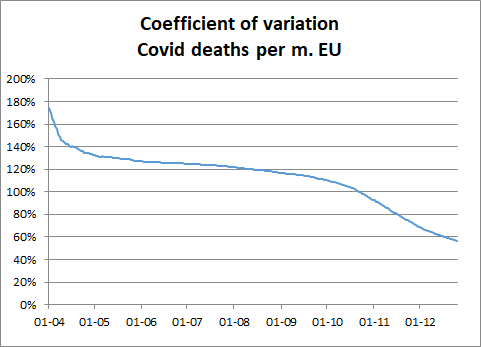
Here we recognize our old friend, reversion to the mean. Tegnell was right: maraton and not sprint, most of the countries will converge:

3/
But something strange is happening. CEE countries did not only catch up, they accumulated more deaths in total, 8 of them in top 13 now (remember, only 1 in the 1st wave):

4/
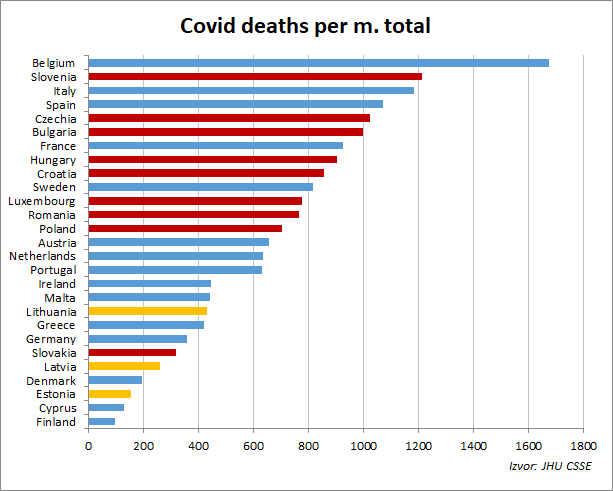
So what's happening? There is one explanation coming to my mind. The dark number in the first wave was much higher, and Western countries in fact much more exposed than visible from this chart (confirmed infections in the first wave ...

5/
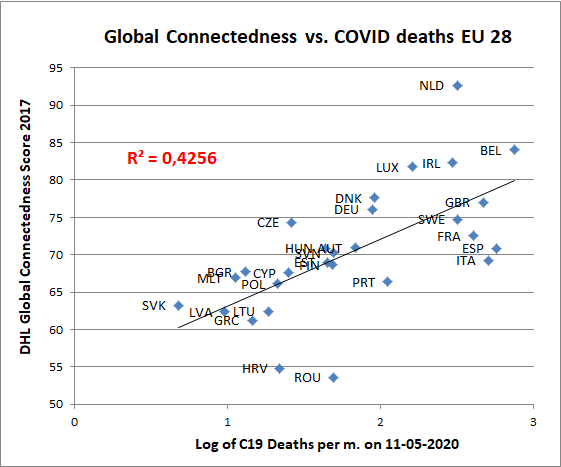
and the first wave was less lethal due to seasonality (spring infection smaller IFR than autumn ifections). Now, why the Western countries were much more infected in the 1st wave? There is a very strong case for inlt. connectedness. I used a very imperfect measure ...
6/
... DHL connectedness index. Still, it has a very large correlation. Imagine using a better description of conn. (land daily intl. migrations) and accounting for one-offs, like 1 m. Swedes going for holidays last week in Feb. (an old chart of mine, but you get the point).

7/
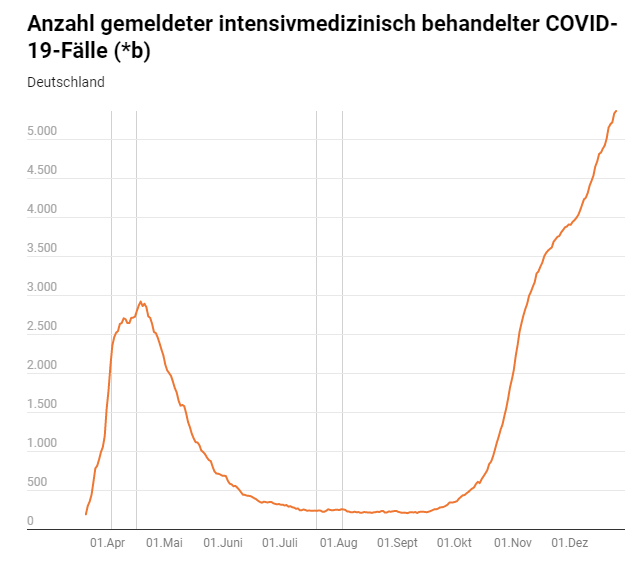
So an explanation might be that before the epidemics withdrew in Spring, those nations which were spared in the 1st wave accumulated less immunity, and had to 'pay back' during more lethat Autumn/Winter. Unfortunately, it seems that's also happening to Germany ...

8/
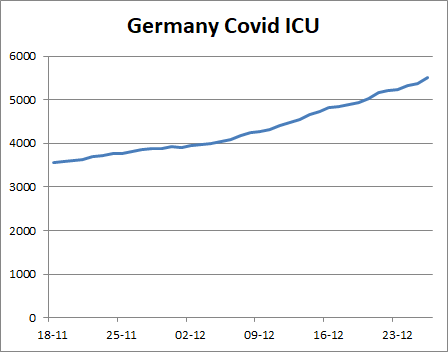
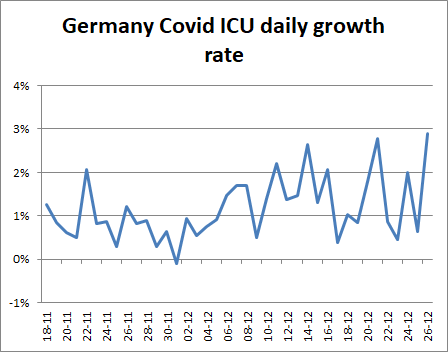
Look at the ICU beds used for Covid as a leading indicator of what is to happen:

(Please take a look at the thread: @BallouxFrancois @boriquagato @justin_hart @mgmgomes1 @freddiesayers @FatEmperor)

9/9
10/9 This does not look nice at all, with today's data

• • •

Missing some Tweet in this thread? You can try to force a refresh
 

Keep Current with Nenad Bakic

Nenad Bakic Profile picture

Stay in touch and get notified when new unrolls are available from this author!

Read all threads

This Thread may be Removed Anytime!

PDF

Twitter may remove this content at anytime! Save it as PDF for later use!

Try unrolling a thread yourself!

how to unroll video
  1. Follow @ThreadReaderApp to mention us!

  2. From a Twitter thread mention us with a keyword "unroll"
@threadreaderapp unroll

Practice here first or read more on our help page!

More from @nbakic

4 Nov
1/x Covid - Europe: The 2nd Wave collapse continutes

We continue with daily overview using JHU data (+some) looking at 'fast' weekly changes (day over the same day the prev. week) this gives us an edge in being up-to-date.

@kerpen @BallouxFrancois @boriquagato @FatEmperor
2/x Changes in weekly growth rates reflect changes in R's, thus these charts roughly represent changes in R's. Now let's see for particular countries .... but overall looking at the continent gives us a 'situational awareness' since this is like a savanah fire ....
3/ Czechia and Belgium were 'second wave Lombardia' they are doing particularly well. In fact that's due to e.g. Czechia having 2,5% population officially infected in 5 weeks, with their dark probably some 25% - it had to stop.
Read 11 tweets
5 Sep
1/ Now REALLY interesting results from Sweden. After current infection rate at ~0% published on Thu, yesterday seroprevalence in a Stockholm district in June (related to infection prevalence beg. of June) showed 18.7% AB. Allowing for addtl. 3 mo. buildup, probably ~25% now ...
2/ ... leading to countrywide prevalence od probably at least 15% (having in mind Stockholm is big and there are some other big cities). Karolinska research found out 2/3 infected did not develop measurable AB, meaning 40% country-wide infection has been reached ....
3/ ... and infection collapsed, as predicted by models using (naturally!) heterogenity. For sure reaching HIT does not mean the infections stops, just it slows down to a weak propagation, together with potential smaller local outbrakes.
Read 4 tweets
2 Jul
1/ Calling @IHME_UW to correct GIGO model for Croatia which, using wrong inputs and unclear algorithms produces ludicrous projections and compromises trust in the integritiy of the whole project
@MLevitt_NP2013
2/ The model anticipates 1500 COVID victims in Croatia by 1-10-2020, the current no. being 108. That's 14 times more. Comparison with neighb. Serbia and BiH really puzzles, projected deaths/m. being 11 and 5 times higher though the current situation is inverse, especially trends
3/ The model itself screems 'unreliable' adding 1500 'expected' victims from the last 'observed' data and the 95% interval between 0 (!) and some 17,000 (!) cases growth. The latest seroprevelence figures by the gvt. are in the 2% zone, implying IFR of some 0.125% ...
Read 9 tweets

Did Thread Reader help you today?

Support us! We are indie developers!


This site is made by just two indie developers on a laptop doing marketing, support and development! Read more about the story.

Become a Premium Member ($3/month or $30/year) and get exclusive features!

Become Premium

Too expensive? Make a small donation by buying us coffee ($5) or help with server cost ($10)

Donate via Paypal Become our Patreon

Thank you for your support!

Follow Us on Twitter!