Secondary attack rate measures transmission risk per-contact, so above suggests difference between groups spreading old and new variant isn't down to one group simply having more contacts. This is consistent with data from our recent pre-print (cmmid.github.io/topics/covid19…)
In other words, it seems the new variant VOC 202012/01 has a different ’T’ to the old one.
Why a SARS-CoV-2 variant that's 50% more transmissible would in general be a much bigger problem than a variant that's 50% more deadly. A short thread... 1/
As an example, suppose current R=1.1, infection fatality risk is 0.8%, generation time is 6 days, and 10k people infected (plausible for many European cities recently). So we'd expect 10000 x 1.1^5 x 0.8% = 129 eventual new fatalities after a month of spread... 2/
What happens if fatality risk increases by 50%? By above, we'd expect 10000 x 1.1^5 x (0.8% x 1.5) = 193 new fatalities. 3/
The susceptibility profile may also be different. In flu pandemics, susceptibility is often concentrated in younger groups (pubmed.ncbi.nlm.nih.gov/20096450/) - for COVID-19, severity/susceptibility concentrated in older groups (e.g. nature.com/articles/s4159…). 3/
Some locations in Tier 3 had evidence of rising epidemics before November lockdown; others were declining. Same for Tier 1 & 2 – some were rising; some were declining. How come? There are three likely explanations... 1/
First, things like population demography, household structure, and nature of local industry will influence social interactions and hence transmission potential. As a result, baseline R may just be slightly lower in some locations. 2/
Second, high levels of infection will lead to some accumulation of immunity (in short-term, at least). Unlikely it's enough to go back to normal without outbreaks, but could be enough for control measures that would get R near 1 in spring to now get R below 1. (Data from ONS) 3/
Relaxing UK COVID-19 control measures over the Christmas period will inevitably create more transmission risk. There are four main things that will influence just how risky it will be... 1/
We can think of as epidemic as a series of outbreaks within households, linked by transmission between households. This is particularly relevant over Christmas, given school holidays and some workplace closures. 2/
We can also think of R in terms of within and between household spread. If the average outbreak size in a household is H, and each infected person in household transmits to C other households on average, we can calculate the 'household' reproduction number as H x C. 3/
Some people are interpreting the below study as evidence that people who test positive without symptoms won't spread infection, but it's not quite that simple. A short thread on epidemic growth and timing of infections... 1/
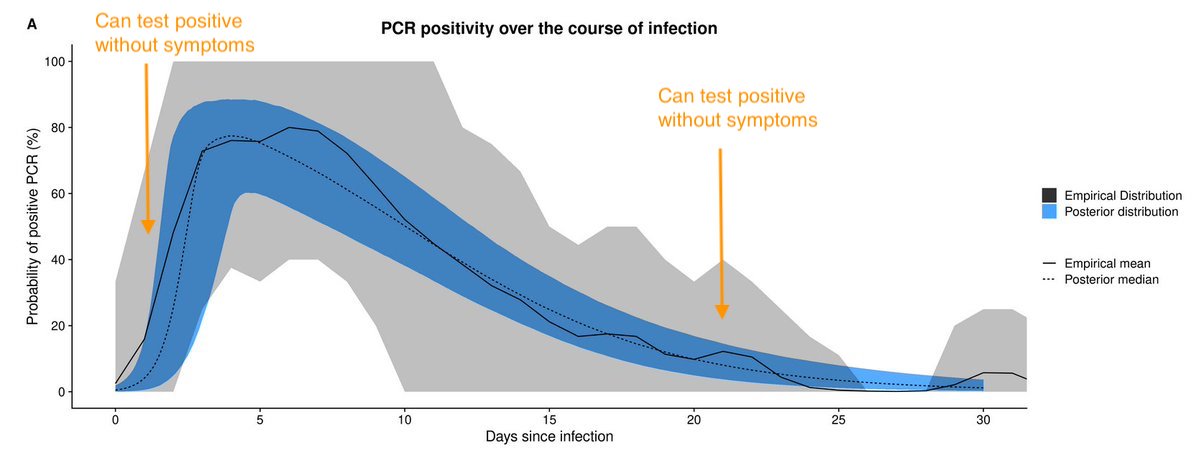
If we assume most transmission comes from those who develop symptoms, there are 2 points where these people can test positive without having symptoms - early in their infection (before symptoms appear) & later, once symptoms resolved (curve below from: cmmid.github.io/topics/covid19…) 2/
So if people test positive without symptoms, are they more likely to be early in their infection or later? Well, it depends on the wider epidemic... 3/
Why do COVID-19 modelling groups typically produce ‘scenarios’ rather than long-term forecasts when exploring possible epidemic dynamics? A short thread... 1/
Coverage of modelling is often framed as if epidemics were weather - you make a prediction and then it happens or it doesn’t. But COVID-19 isn’t a storm. Behaviour and policy can change its path... 2/
This means that long-term COVID forecasts don’t really make sense, because it’s equivalent of treating future policy & behaviour like something to be predicted from afar (more in this piece by @reichlab & @cmyeaton: washingtonpost.com/outlook/2020/0…). 3/