Weekly all-cause deaths and deaths with/from Covid-19 in Ontario, including % of deaths attributed to Covid-19. 
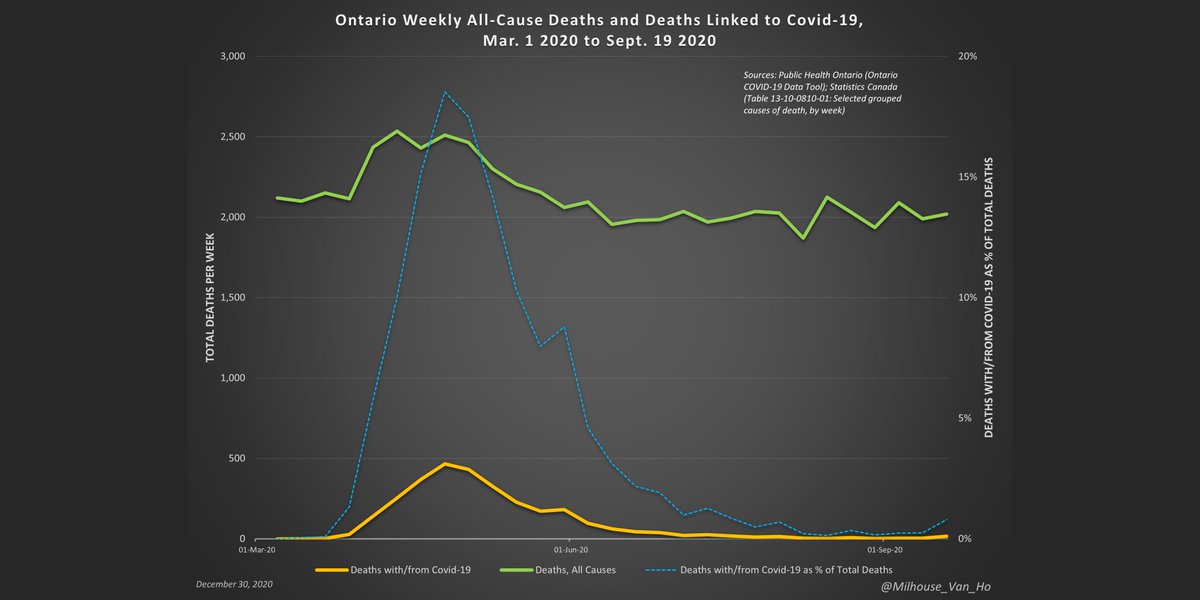
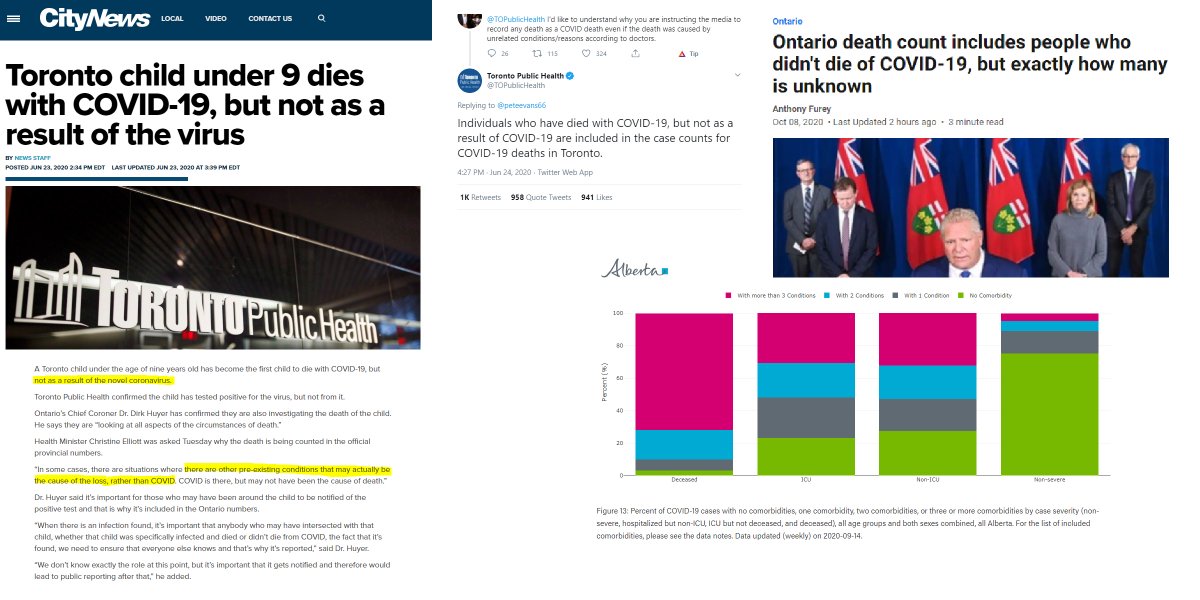
However, Covid-19 is often not a wholly distinct and separate cause of death as there are other medical conditions involved in many cases.
There are also cases in which it is not even a cause of death, but the individual had tested positive sometime prior to their death.
There are also cases in which it is not even a cause of death, but the individual had tested positive sometime prior to their death.
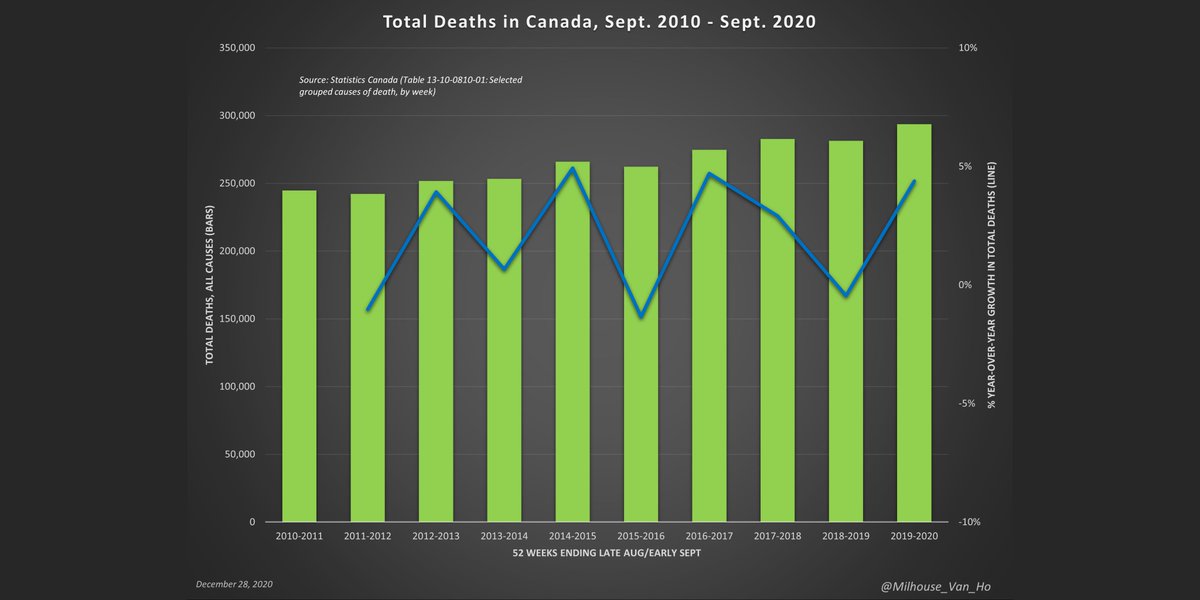
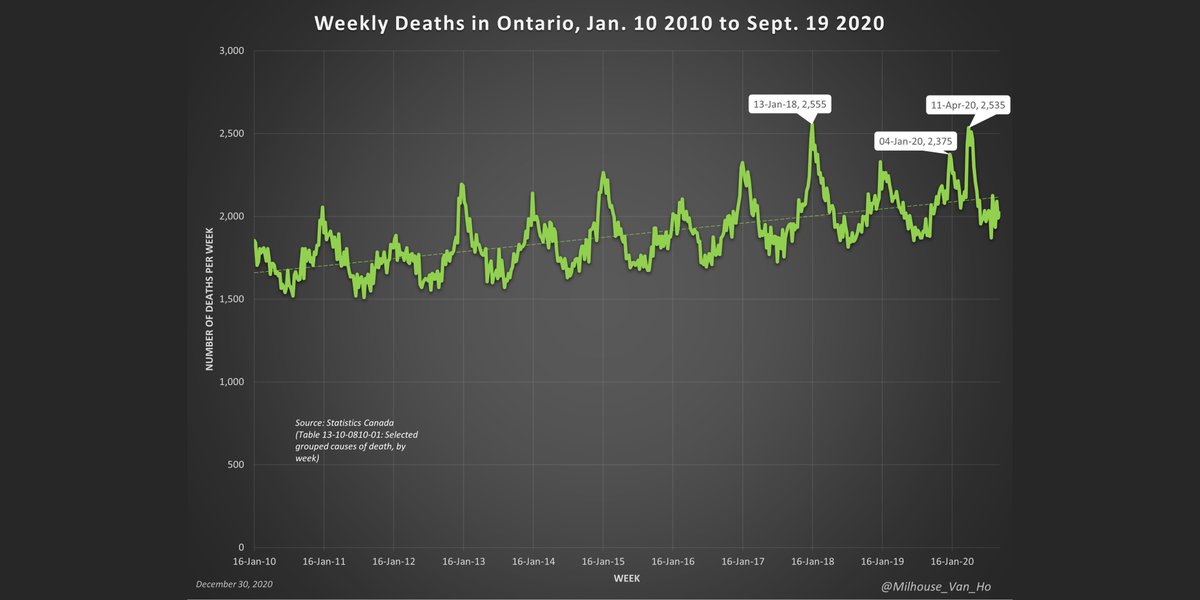
Ontario total weekly deaths 2010-2020.
Covid-19 has been a crisis in Ontario's long-term care (LTC) system vs. among the general public.
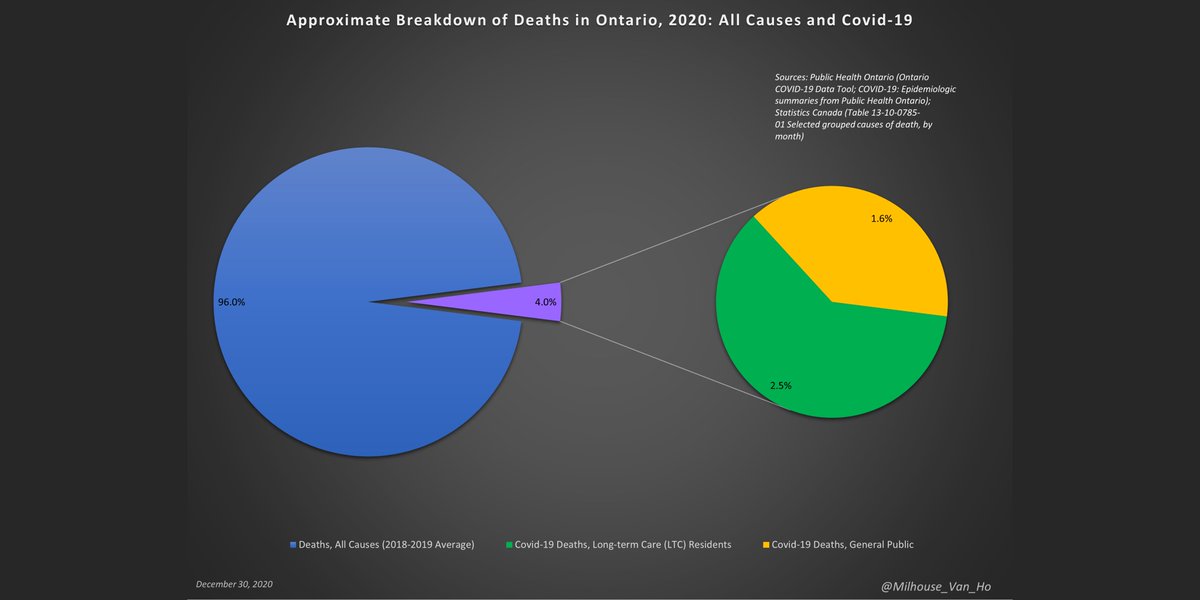
Deaths among long-term care residents (0.5% of the Ontario population) account for 61.2% of all Ontario deaths from/with Covid-19.
If the Covid-19 fatality rate for long-term care homes was applied to the Ontario population, the province would have now had over 502,000 deaths.
If the Covid-19 fatality rate for long-term care homes was applied to the Ontario population, the province would have now had over 502,000 deaths.
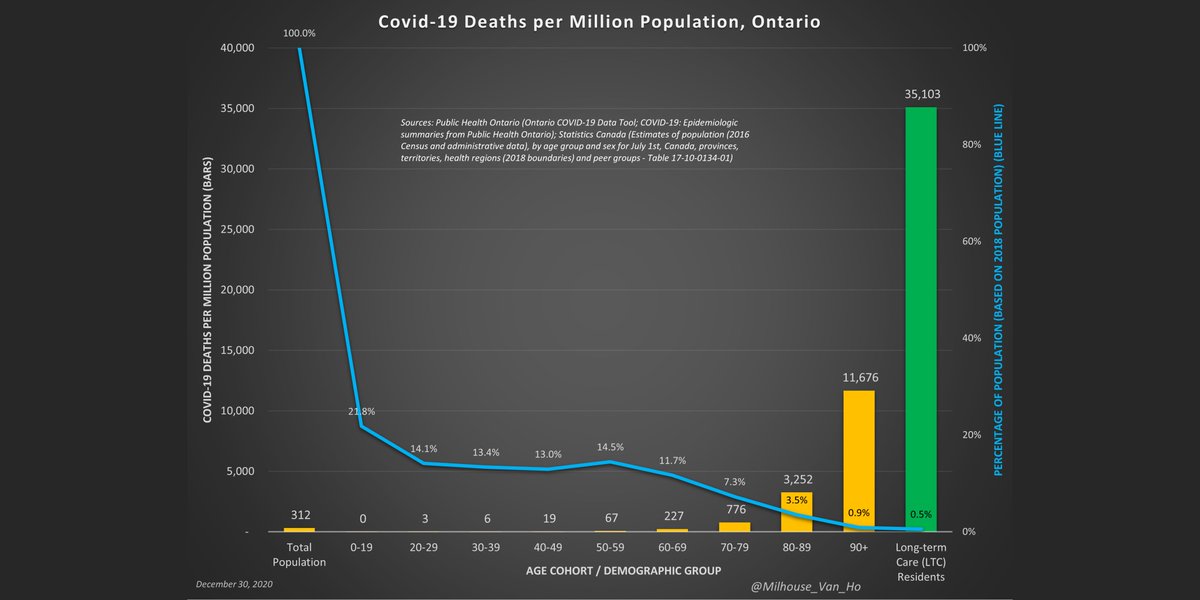
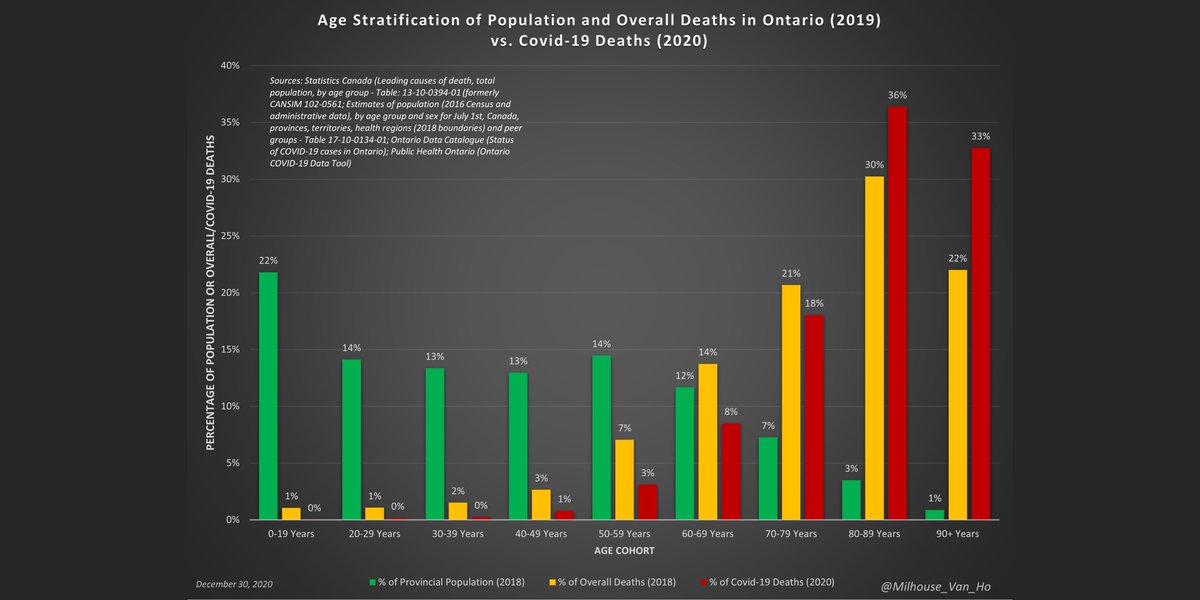
The 80+ age cohort accounts for 52% of all-cause deaths in Ontario and 69% of deaths from or with Covid-19, but only 4% of the population.
In contrast, children account for 22% of the pop. but only 1% of all-cause deaths in Ontario and 0% (0.02%) of deaths from or with Covid-19.
In contrast, children account for 22% of the pop. but only 1% of all-cause deaths in Ontario and 0% (0.02%) of deaths from or with Covid-19.
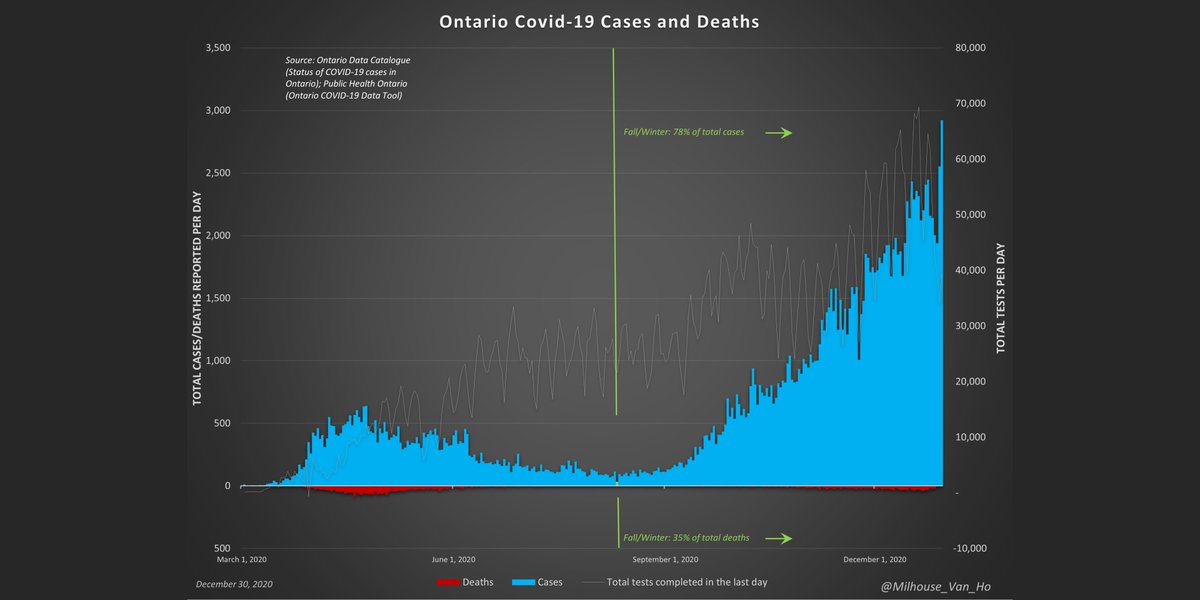
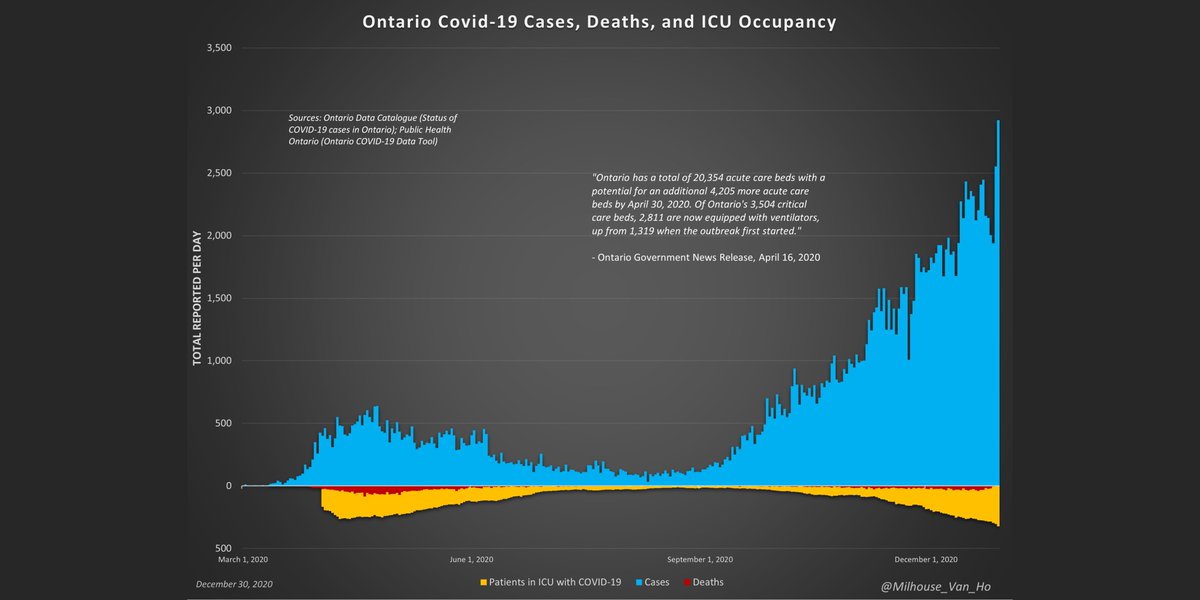
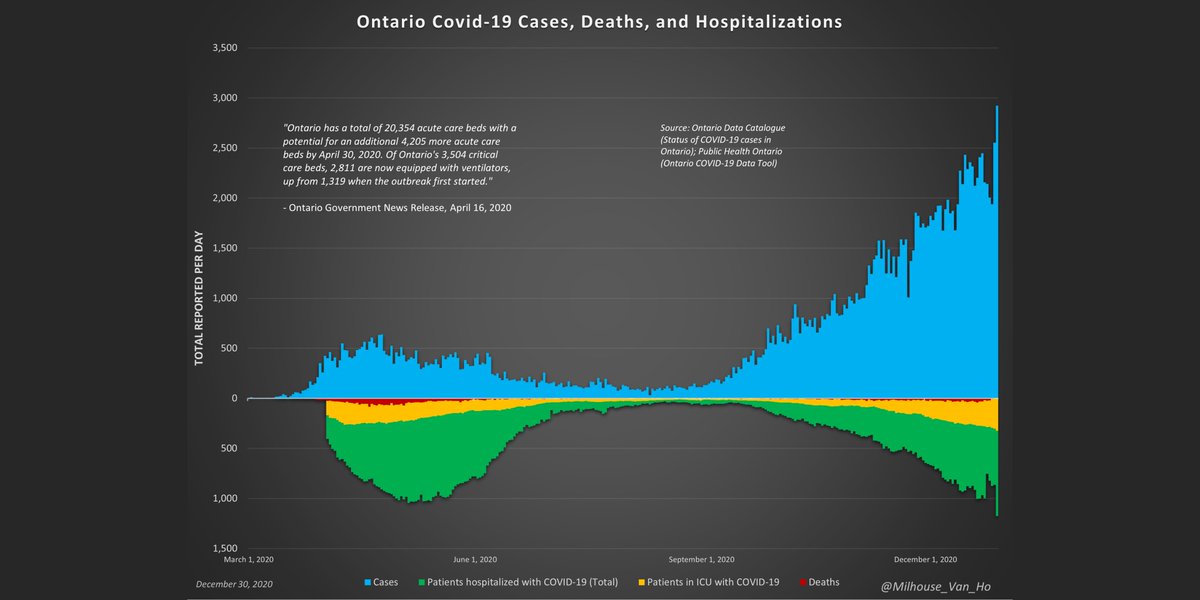
The two most important metrics to watch: deaths and ICU occupancy from or with covid-19.
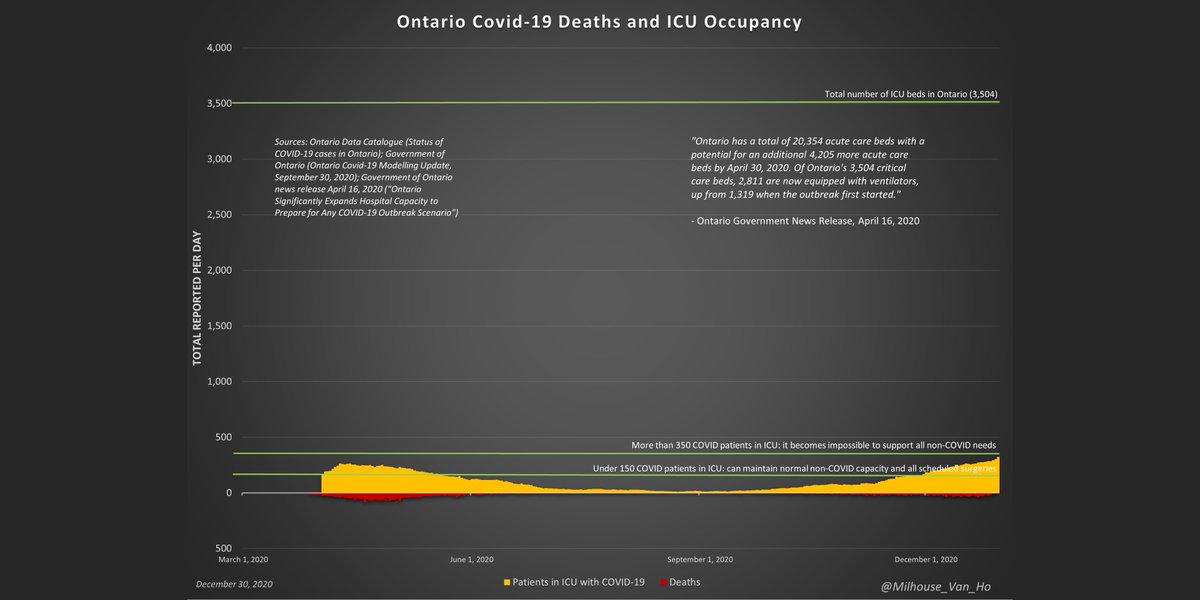
The two most important metrics to watch: deaths and ICU occupancy from or with covid-19.
The number of hospitalizations linked to covid-19 in Ontario has generally not approached levels commonly observed for influenza and pneumonia.
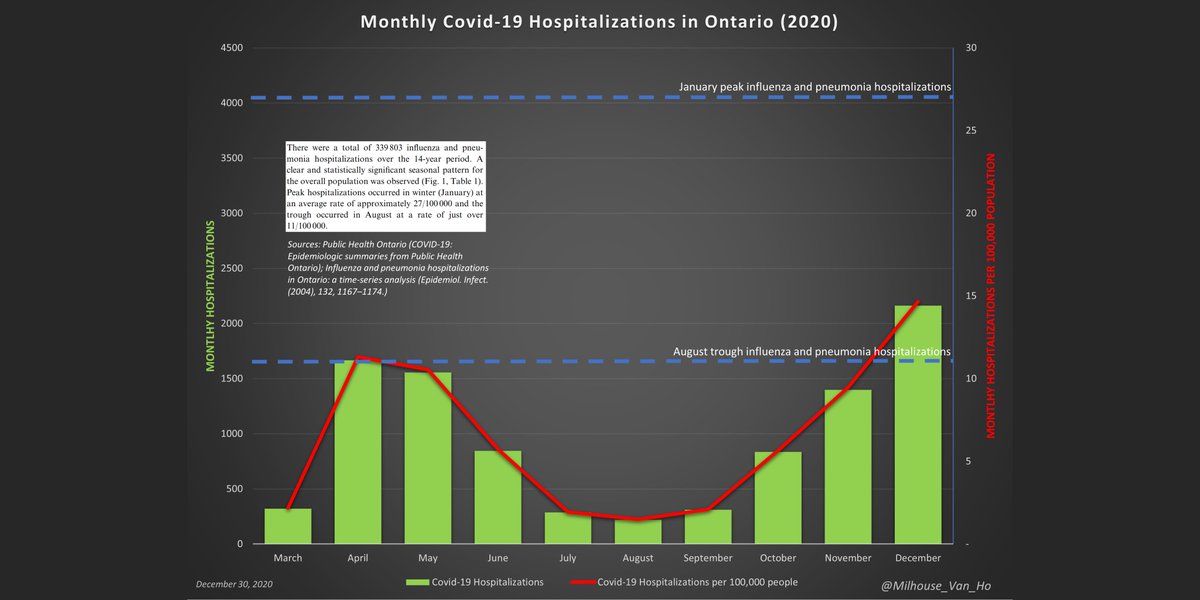
Ontario hospitalizations from or with covid-19.
As data on daily new hospitalizations is not publicly available, this is the average daily net change in hospitalizations (ICU and non-ICU).
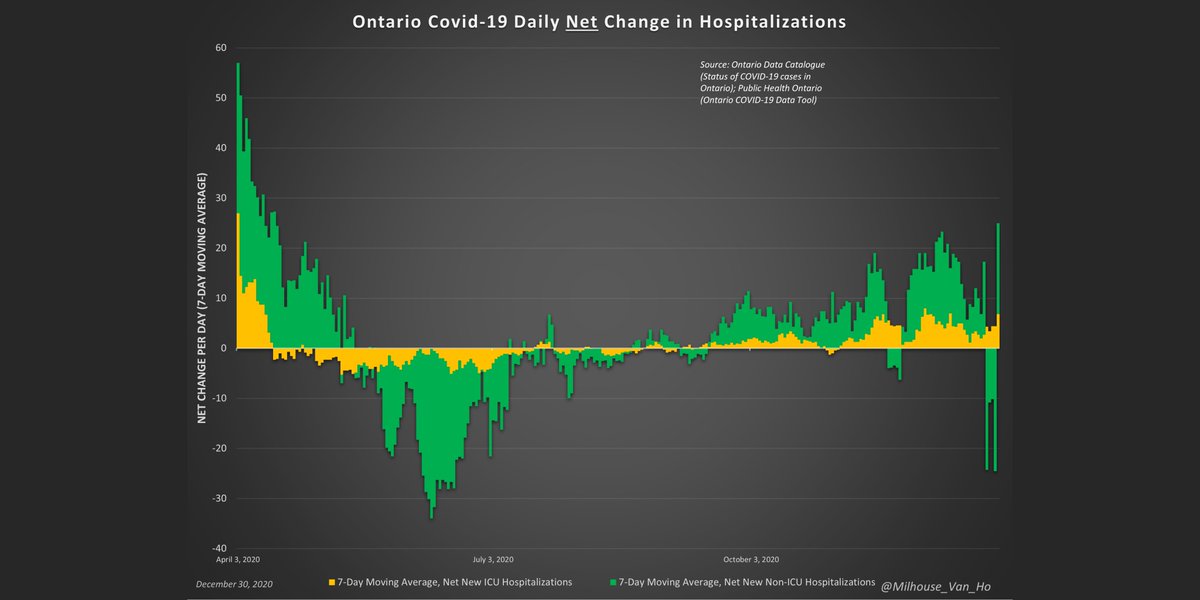
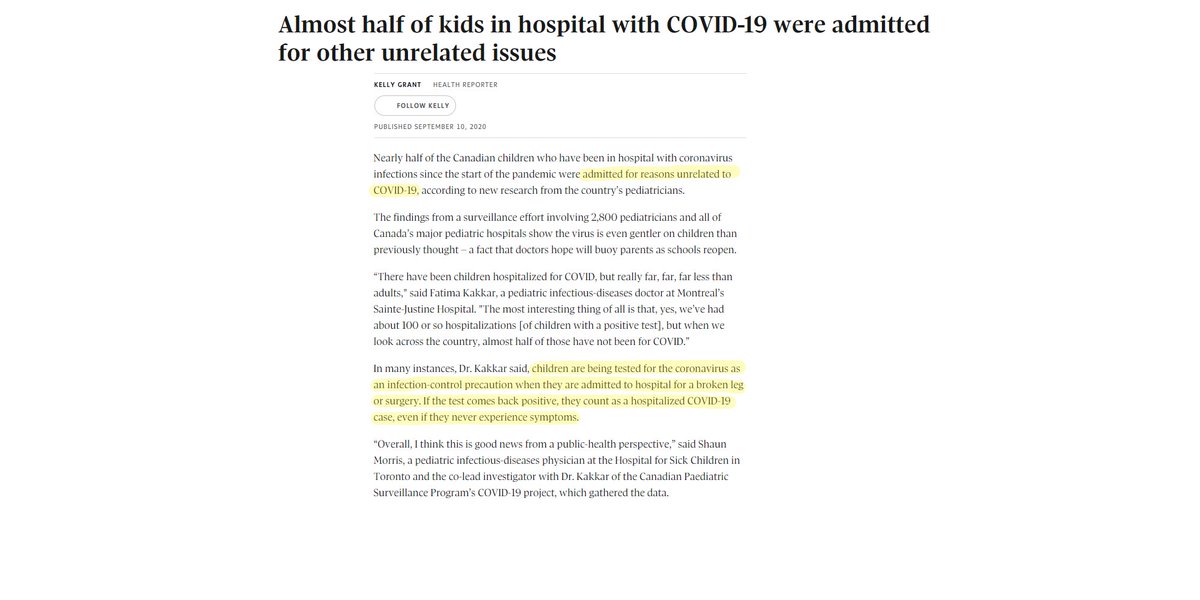
A note on hospitalization data: This may include those who have had a positive test result after being hospitalized for a different reason.
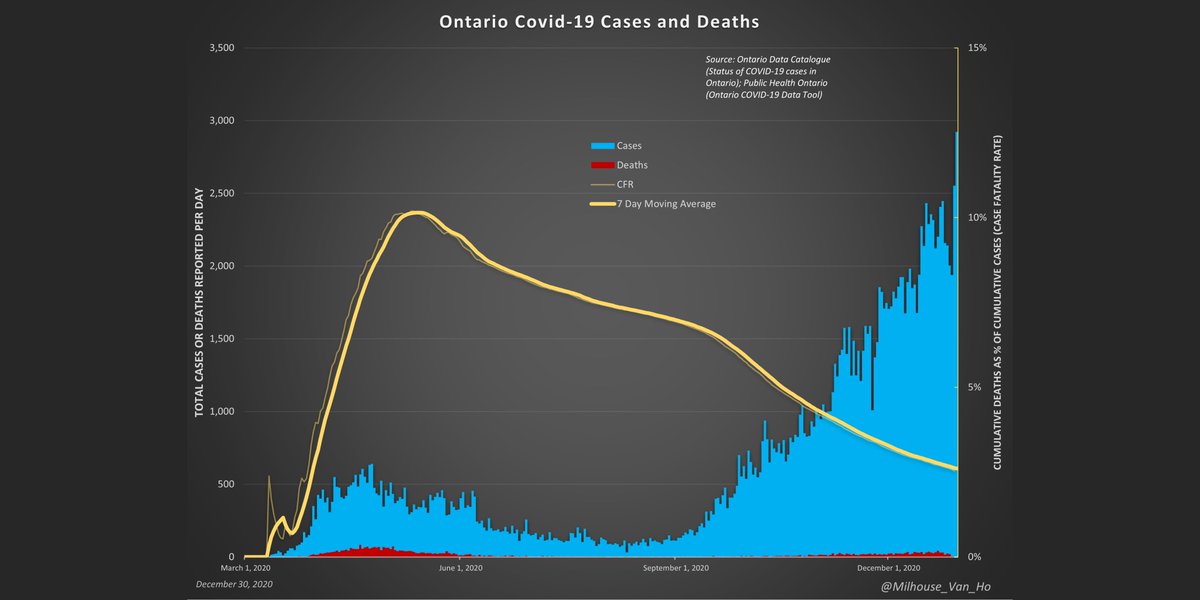
Ontario - The proportion of cases (positive test results) resulting in death (yellow line). (Daily reported deaths divided by average daily cases over prior 28 days.)
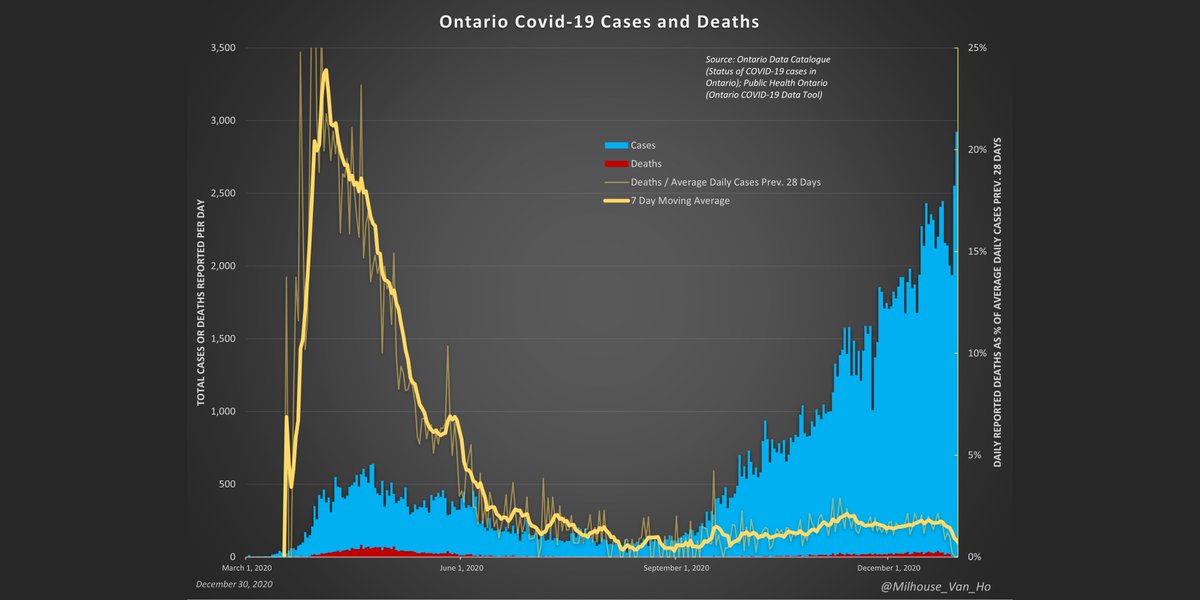
The silver lining of mass PCR testing: a falling CFR.
Ontario – Cumulative case fatality rate (CFR). The proportion of cases (positive test results) resulting in death (yellow line). (Cumulative reported deaths divided by cumulative cases.)
Ontario – Cumulative case fatality rate (CFR). The proportion of cases (positive test results) resulting in death (yellow line). (Cumulative reported deaths divided by cumulative cases.)
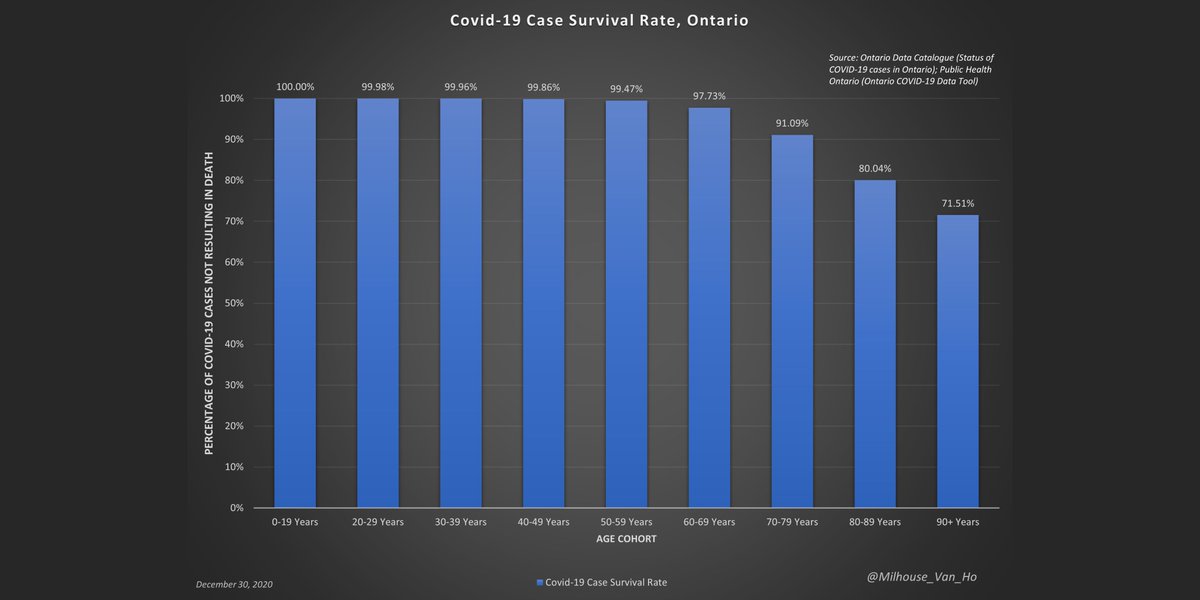
Ontario – Case survival rates (= 100% - case fatality rate) by age.
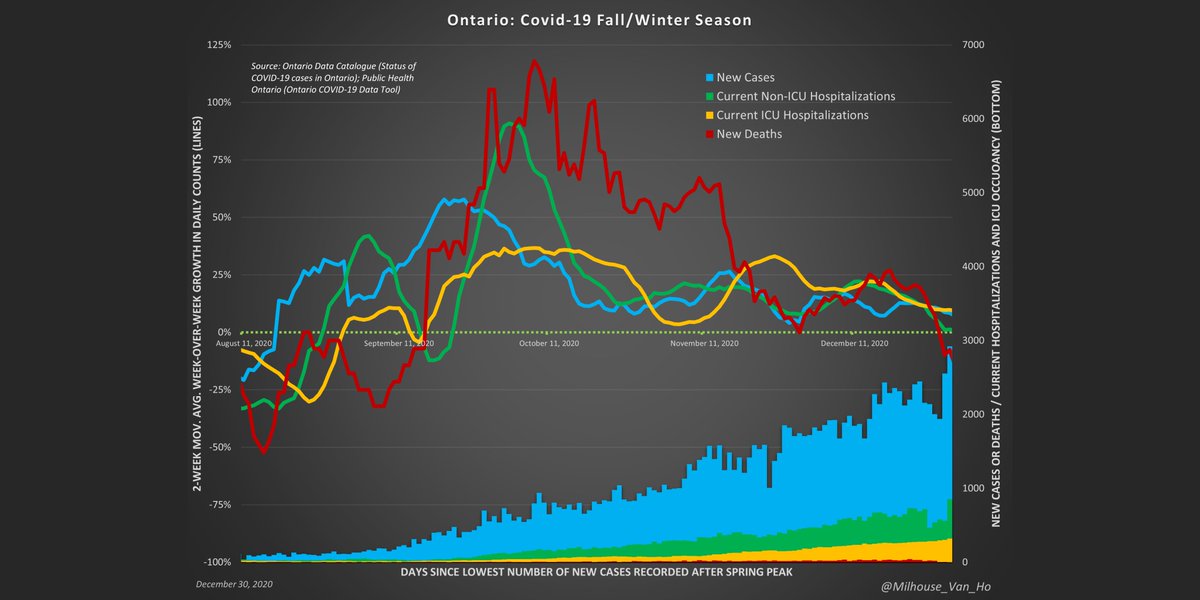
Ontario Fall/Winter season: May be able to declare a peak when average week-over-week growth reaches zero.
• • •
Missing some Tweet in this thread? You can try to
force a refresh