2020 saw a huge turnaround within the S&P 500 index after the vaccine news broke on 11/9/20.
Stocks that fared the worst through 11/9/20 saw the largest increases post-vax (on average, through year-end).
Sector attributions below 👇
1/
Stocks that fared the worst through 11/9/20 saw the largest increases post-vax (on average, through year-end).
Sector attributions below 👇
1/

Tech/Cons. Dis/Comm. made up all the returns until 11/6 with Financials/Energy dragging.
Post-vax news, Financials was the biggest contributor, though Tech was still #2.
Energy continued to dragged!
2/
Post-vax news, Financials was the biggest contributor, though Tech was still #2.
Energy continued to dragged!
2/

Big reason for Tech continuing to shine post-vax was $AAPL - the top contributor to S&P 500 returns pre- & post 11/9/20.
But large shifts below.
Pre-vax, #2-5 was $AMZN $MSFT $GOOG $NVDA & all others had net negative contribution.
Post-vax, #2-5 was $DIS $JPM $BAC $BRK.
end/
But large shifts below.
Pre-vax, #2-5 was $AMZN $MSFT $GOOG $NVDA & all others had net negative contribution.
Post-vax, #2-5 was $DIS $JPM $BAC $BRK.
end/

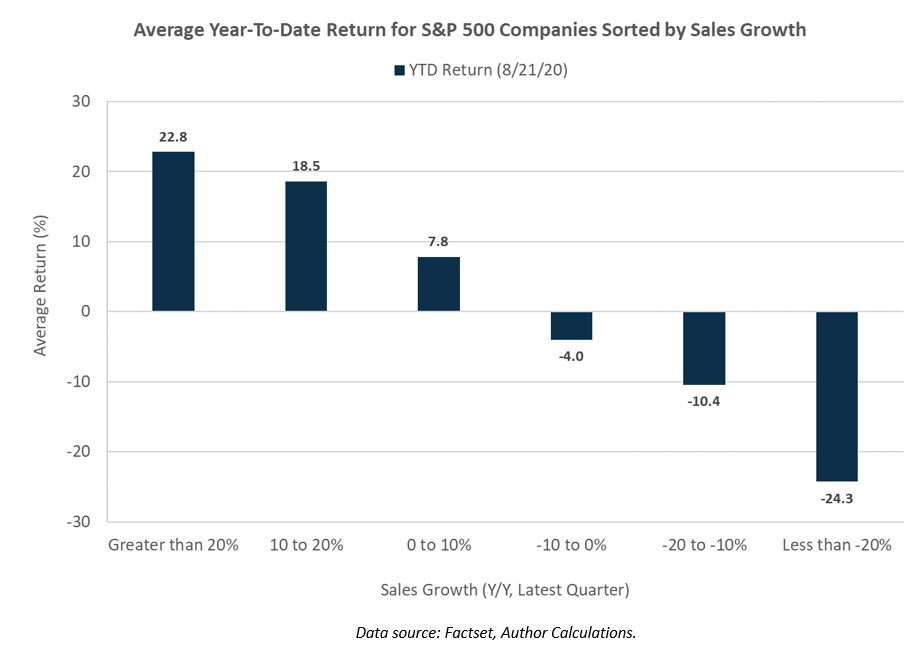
Extending the thread to look at return distributions against fundamental metrics.
Gives another perspective to the post-vax momentum reversal posted on top of this thread.
Chart shows 2020 returns for S&P 500 companies by sales growth:
>20% y/y: +44%
<-20% y/y: -21%
4/
Gives another perspective to the post-vax momentum reversal posted on top of this thread.
Chart shows 2020 returns for S&P 500 companies by sales growth:
>20% y/y: +44%
<-20% y/y: -21%
4/

But again, we see a huge reversal post-vax news on 11/6.
Companies with the the worst sales growth had the best returns on average from 11/6 through year-end.
Reversing what we saw prior to that.
5/
Companies with the the worst sales growth had the best returns on average from 11/6 through year-end.
Reversing what we saw prior to that.
5/

Similar story if you sort by forward P/E ratios.
1st chart:
Stocks with the highest P/Es significantly outperformed those on the other end of the spectrum (incl. those with -ve eps).
2nd chart:
Shows big shift post-vax, when stocks with no eps estimates or P/E < 10 surged.
6/
1st chart:
Stocks with the highest P/Es significantly outperformed those on the other end of the spectrum (incl. those with -ve eps).
2nd chart:
Shows big shift post-vax, when stocks with no eps estimates or P/E < 10 surged.
6/


Post-vax reversal existed even across market cap.
1st chart:
Larger stocks vastly outperformed over the entire year.
2nd chart:
Smaller firms < $25 billion cap (~ 50% of index) surged on average post-vaccine news, reversing their pre-vax losses on average.
/end
1st chart:
Larger stocks vastly outperformed over the entire year.
2nd chart:
Smaller firms < $25 billion cap (~ 50% of index) surged on average post-vaccine news, reversing their pre-vax losses on average.
/end


• • •
Missing some Tweet in this thread? You can try to
force a refresh