Construction sector, bird's eye view 🧵

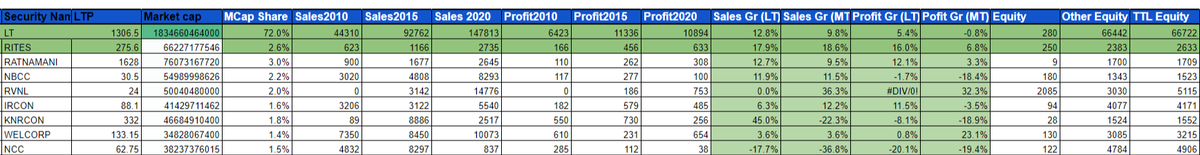
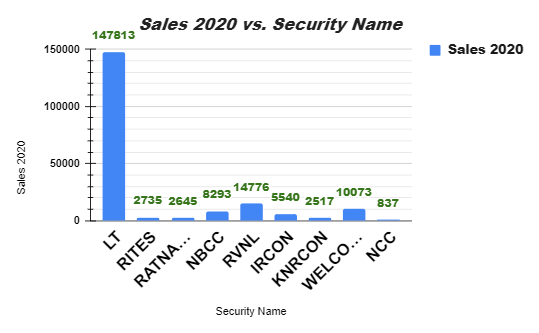
The top player #LnT takes home almost 75% of the market share. The rest are small fish in a pond where L&T is the biggest crocodile.

Qualitative analysis in comments 👇 Image
#LnT makes the largest profit, followed by #RITES Image
#LnT has higher sales and profits than #RITES in absolute terms..

BUT.. ImageImageImage
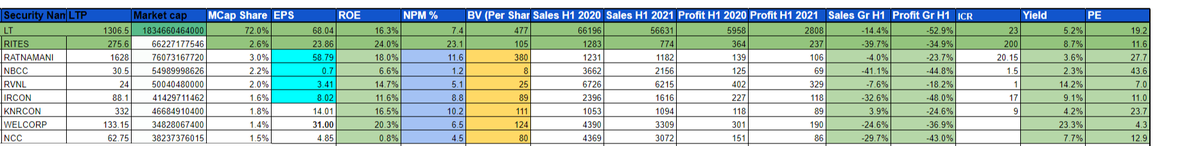
#RITES has better efficiency than #LnT (i.e whatever little profit it churns out, it does it with very low cost, unlike LnT which is laden with debt), hence RITES has higher ROE, NPM and ICR. ImageImageImage
Verdict : The construction sector is very capital intensive sector that does well only when the government does CAPEX for infra projects

LnT & RITES are the only 2 good companies. Buy if bullish on sarkari spending on Infra (100 smart cities, bullet train, river linking project)

• • •

Missing some Tweet in this thread? You can try to force a refresh
 

Keep Current with Generic Boi

Generic Boi Profile picture

Stay in touch and get notified when new unrolls are available from this author!

Read all threads

This Thread may be Removed Anytime!

PDF

Twitter may remove this content at anytime! Save it as PDF for later use!

Try unrolling a thread yourself!

how to unroll video
  1. Follow @ThreadReaderApp to mention us!

  2. From a Twitter thread mention us with a keyword "unroll"
@threadreaderapp unroll

Practice here first or read more on our help page!

More from @techlunatic

6 Jan
🧵#InfoEdge : My attempt at quantifying its rise in numbers. Image
2005 Sales : 51 Cr
2020 Sales : 2500 Cr

Sales growth CAGR : 23% Image
2005 Profit : 4 Cr
2020 Profit : 215 Cr

Profit growth CAGR : 26% Image
Read 4 tweets
4 Jan
#Lalpathlabs valuation 🧵

History : Image
Sales history :

2011 : 240 Cr
2020 : 1300 Cr

Trend : 20.64% CAGR growth in sales. ImageImageImage
Profit history :

2011 : 30 Cr
2020 : 230 Cr

Trend : 25.39% CAGR growth in profits. ImageImageImage
Read 6 tweets
4 Jan
#JubilantFoods valuation (pre-IPO data included): 🧵

History : Image
Sales data :

2006 : 100 Cr
2020 : 4000 Cr

Trend : 27.88% CAGR ImageImageImage
Profit data :

2006 : 5 Cr
2020 : 300 Cr

Trend : 31.38% CAGR ImageImageImage
Read 6 tweets
4 Jan
#Pidilite valuation 🧵

History : Image
Sales trend :

2000 : 470 Cr
2020 : 7500 Cr

Trend : 14.85% CAGR growth Image
Profit growth trend :

2000 : 47 Cr
2020 : 110 Cr

Trend : 17.08% CAGR growth ImageImage
Read 4 tweets
4 Jan
#Nestle valuation 🧵

History : Image
Sales trend :

2002 : 2000Cr
2020 : 14000Cr

Sales growth rate : 11.42% CAGR

Note the sales dip during Maggi fiasco : ImageImage
Profit trend :

2002 : 200Cr
2020 : 1900Cr

Profit growth rate : 13.32% CAGR ImageImage
Read 4 tweets
4 Jan
Retail stores, bird's eye view 🧵

Reliance Retail is 5X bigger than DMart, but it is not listed separately. ImageImage
#DMart has the highest margin (5.5%)

Spencer and Taaza stores have the lowest margins. (Strongly avoid) ImageImage
Current trend : Reliance Retail and DMart are leading the pack. The rest are struggling to survive. Image
Read 4 tweets

Did Thread Reader help you today?

Support us! We are indie developers!


This site is made by just two indie developers on a laptop doing marketing, support and development! Read more about the story.

Become a Premium Member ($3/month or $30/year) and get exclusive features!

Become Premium

Too expensive? Make a small donation by buying us coffee ($5) or help with server cost ($10)

Donate via Paypal Become our Patreon

Thank you for your support!

Follow Us on Twitter!