Mise à jour du Québec

#covid19Qc #covid19canada #COVID19

Nombre total de cas et de décès liés à Covid-19 au Québec.
Les deux paramètres les plus importants à surveiller: les décès et hospitalisations aux soins intensifs.
Hospitalisations en cours au Québec.
Nouvelles hospitalisations liées à la COVID-19 au Québec.
La proportion de cas entraînant la mort (décès / cas quotidiens moyens au cours des 28 derniers jours) (ligne jaune).
Cas cumulés en pourcentage des décès cumulés (taux de mortalité clinique) (ligne jaune).
Automne / hiver au Québec : On peut être en mesure de déclarer un pic quand croissance moyenne d'une semaine à l'autre s'approche de zéro.
Nombre total de décès hebdomadaires au Québec de janvier 2010 à octobre 2020.
Les décès liés au Covid-19 au Québec sont extrêmement concentrés dans les CHSLD et CH, RPA et RI.

• • •

Missing some Tweet in this thread? You can try to force a refresh
 

Keep Current with Milhouse Van Houten 🙂

Milhouse Van Houten 🙂 Profile picture

Stay in touch and get notified when new unrolls are available from this author!

Read all threads

This Thread may be Removed Anytime!

PDF

Twitter may remove this content at anytime! Save it as PDF for later use!

Try unrolling a thread yourself!

how to unroll video
  1. Follow @ThreadReaderApp to mention us!

  2. From a Twitter thread mention us with a keyword "unroll"
@threadreaderapp unroll

Practice here first or read more on our help page!

More from @Milhouse_Van_Ho

7 Jan
Ontario update.

#COVID19Ontario #covid19Canada #COVID19

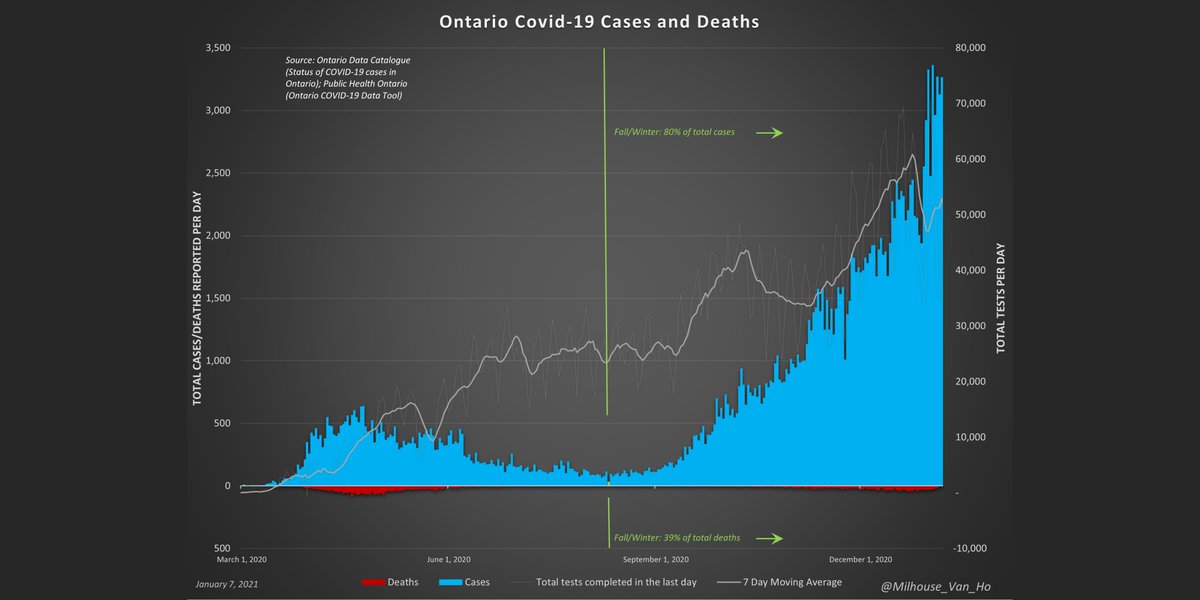
Ontario covid-19 cases, deaths, and testing. Image
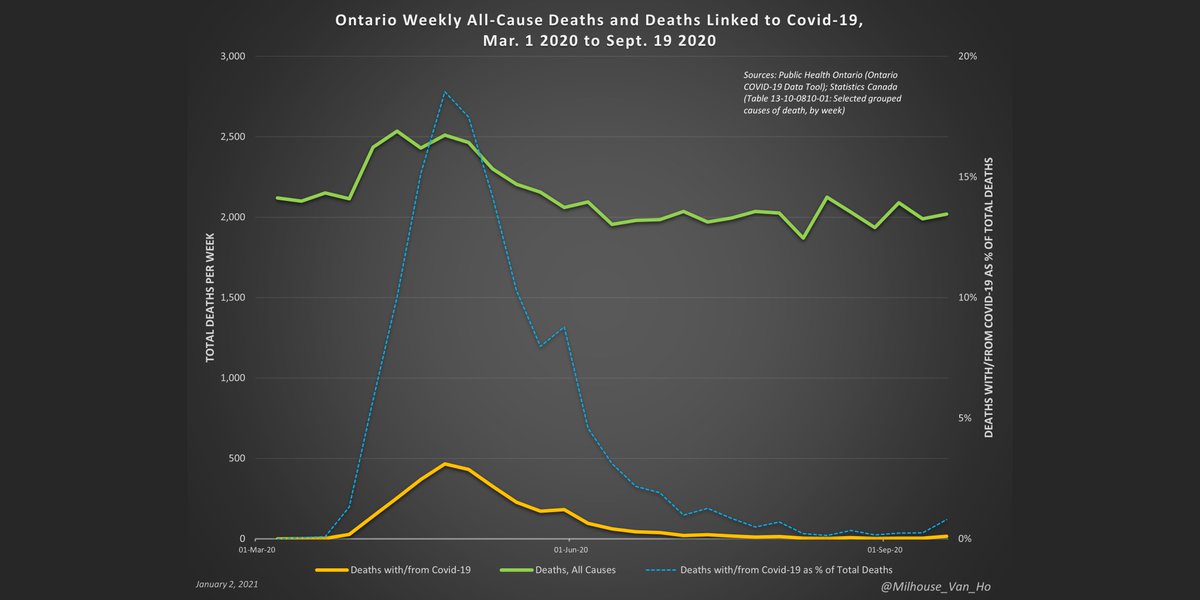
Weekly all-cause deaths and deaths with/from Covid-19 in Ontario, including % of deaths attributed to Covid-19. Image
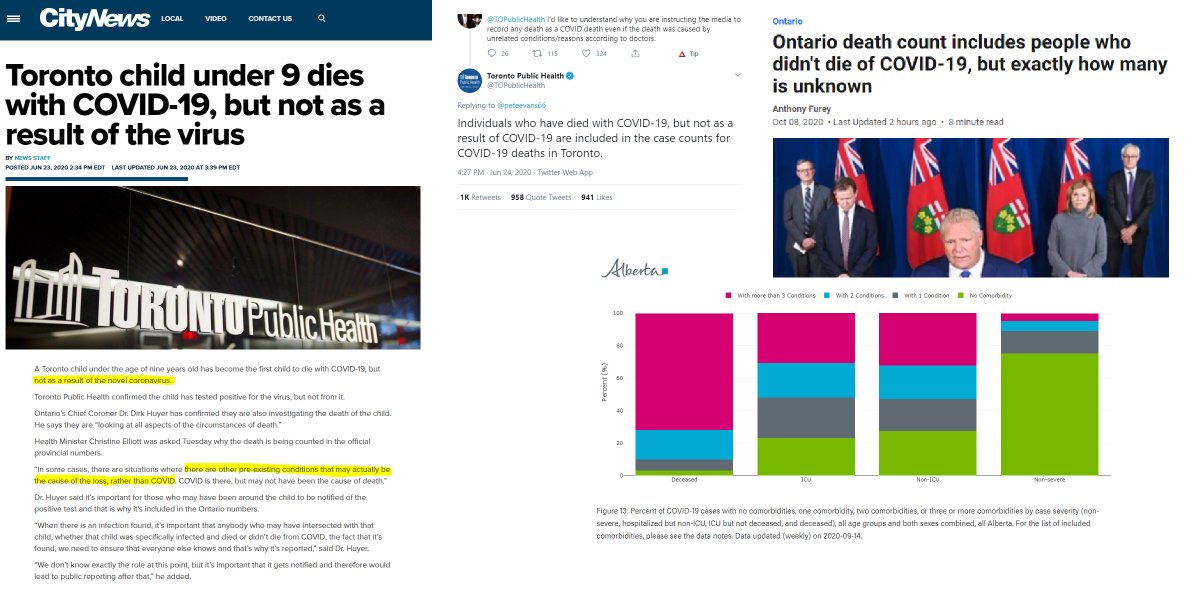
Note: Covid-19 is often not a wholly distinct and separate cause of death as there are other medical conditions involved in many cases.

There are also cases in which it is not even a cause of death, but the individual had tested positive sometime prior to their death. Image
Read 18 tweets
5 Jan
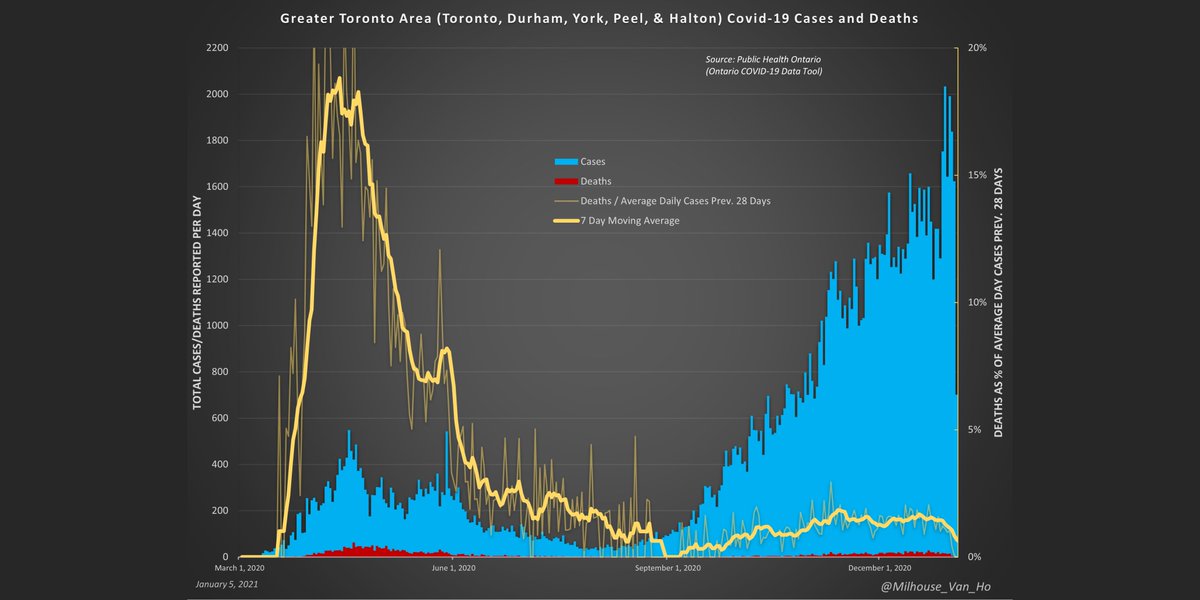
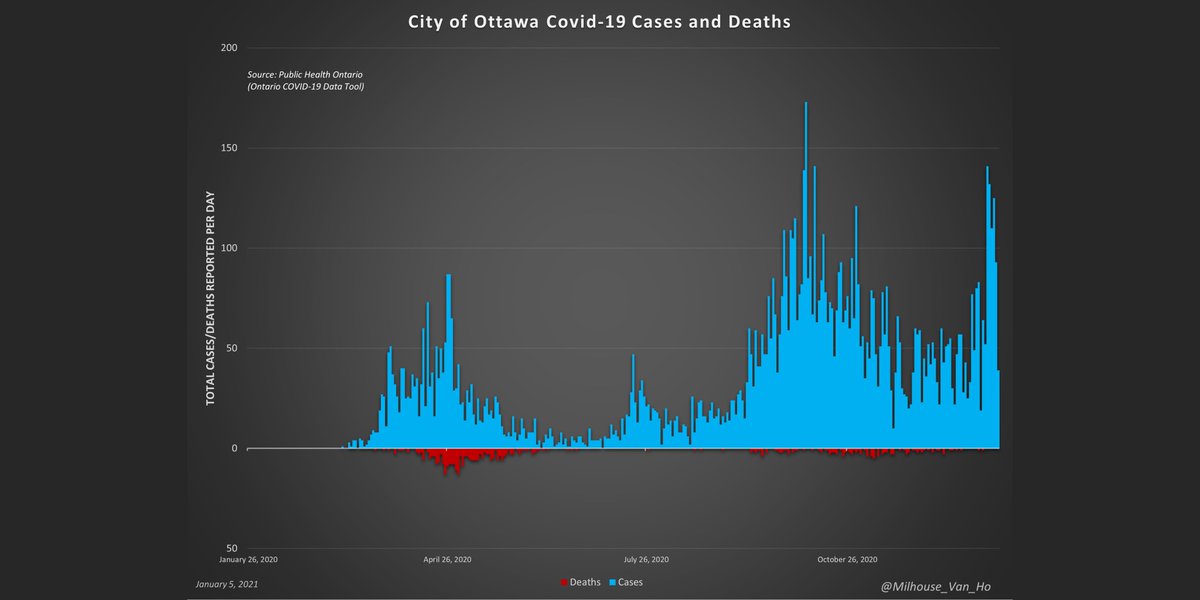
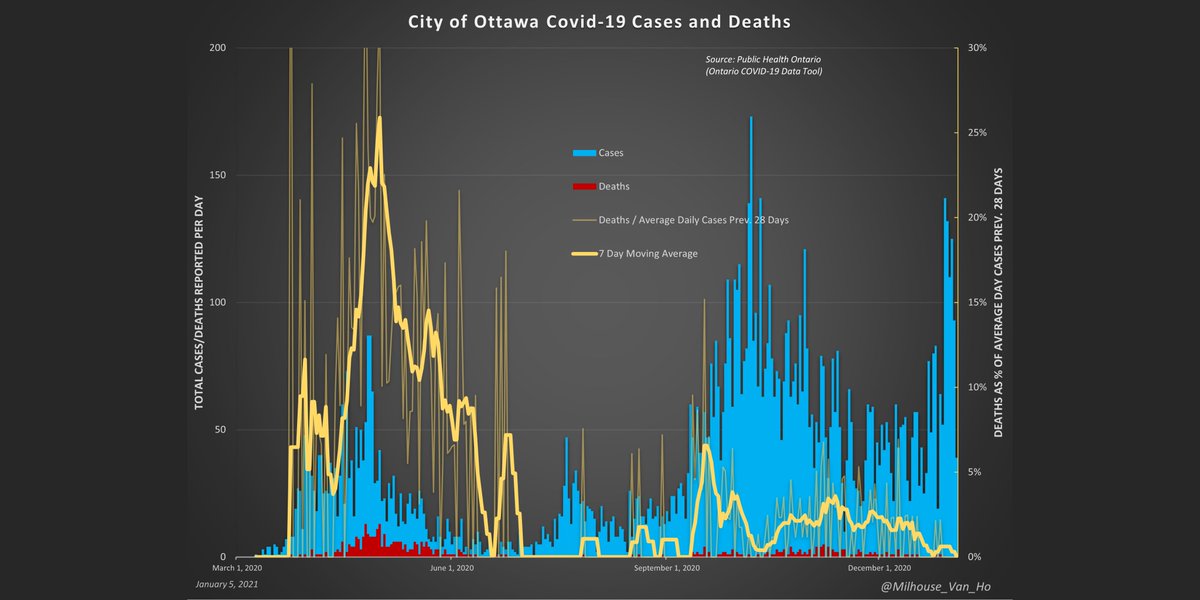
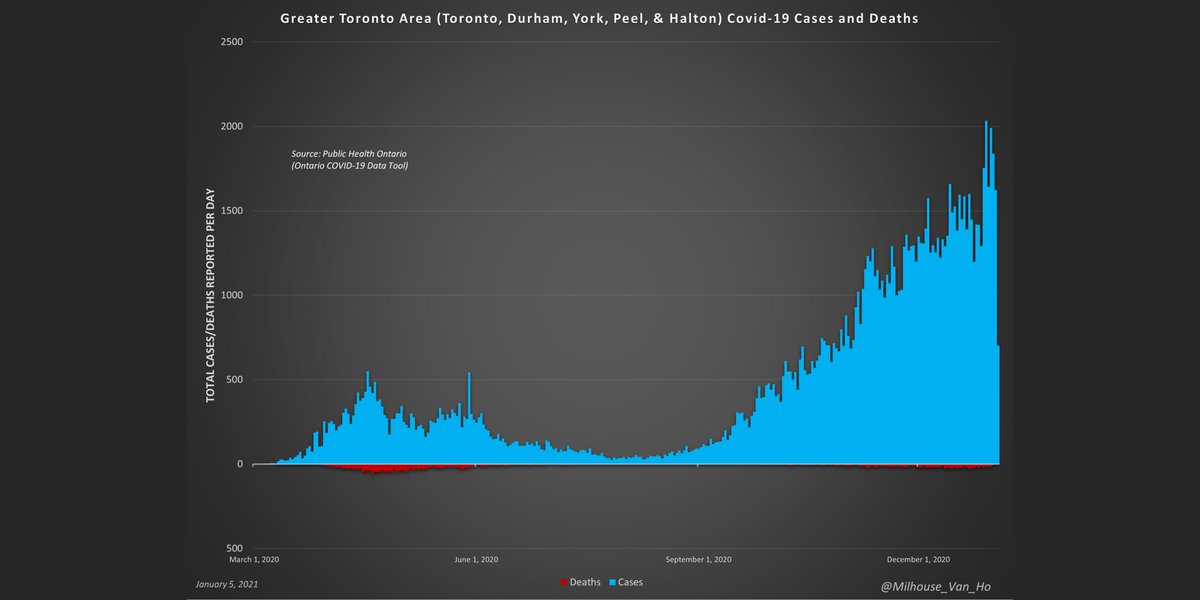
Greater Toronto and Ottawa charts.

#COVID19 #COVID19toronto #covid19ottawa #COVID19Ontario ImageImageImageImage
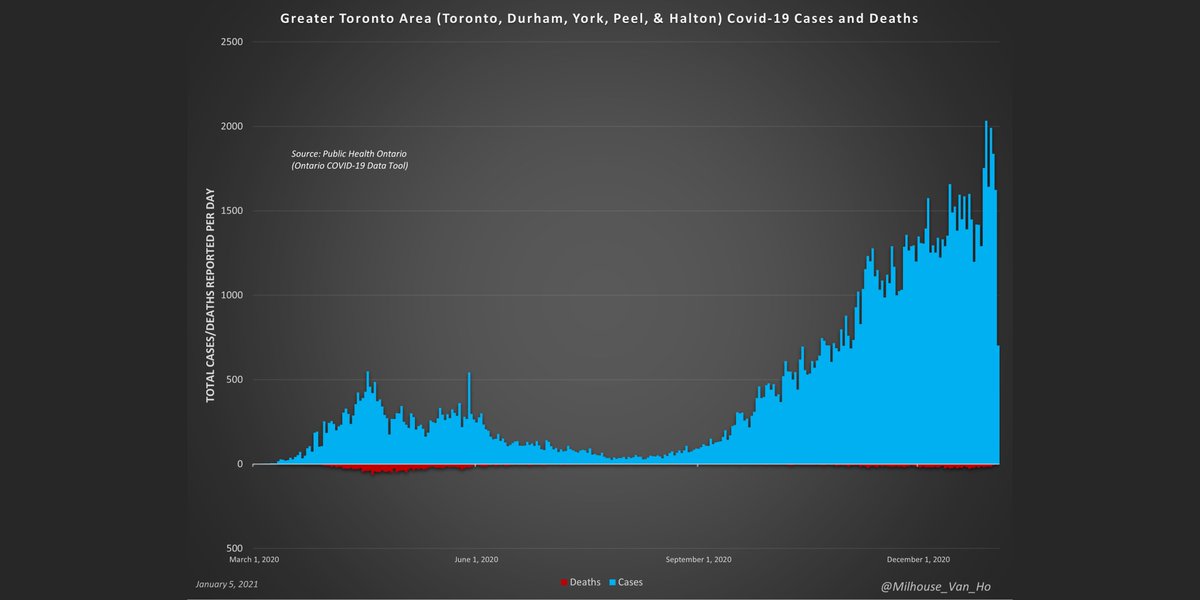
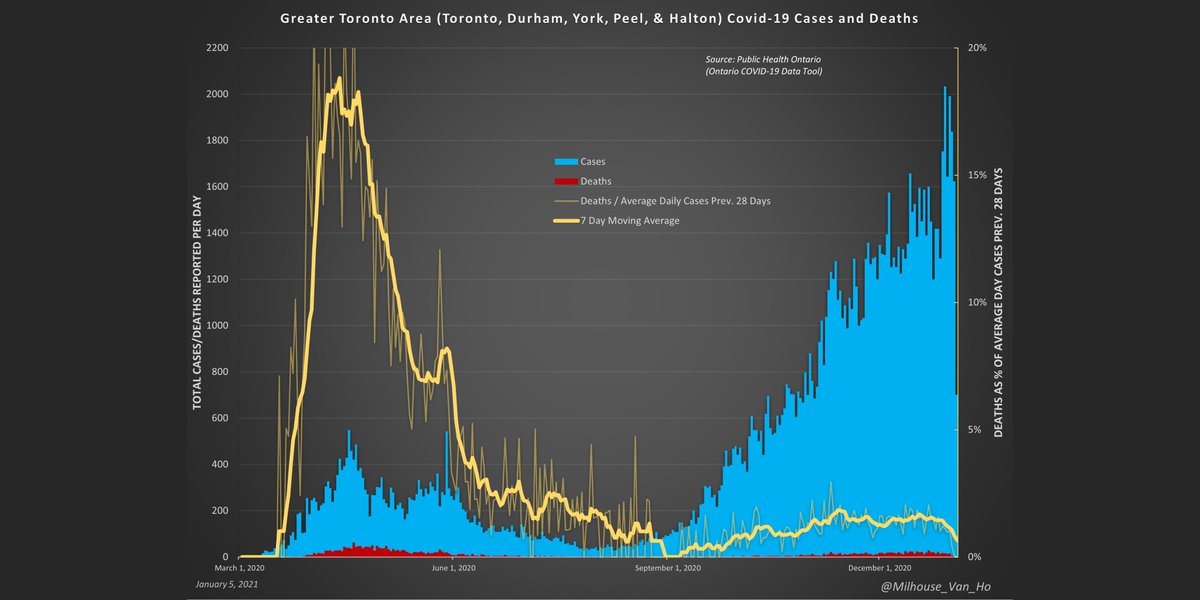
Greater Toronto. Image
Greater Toronto - The proportion of cases (positive test results) resulting in death (yellow line). Image
Read 12 tweets
4 Jan
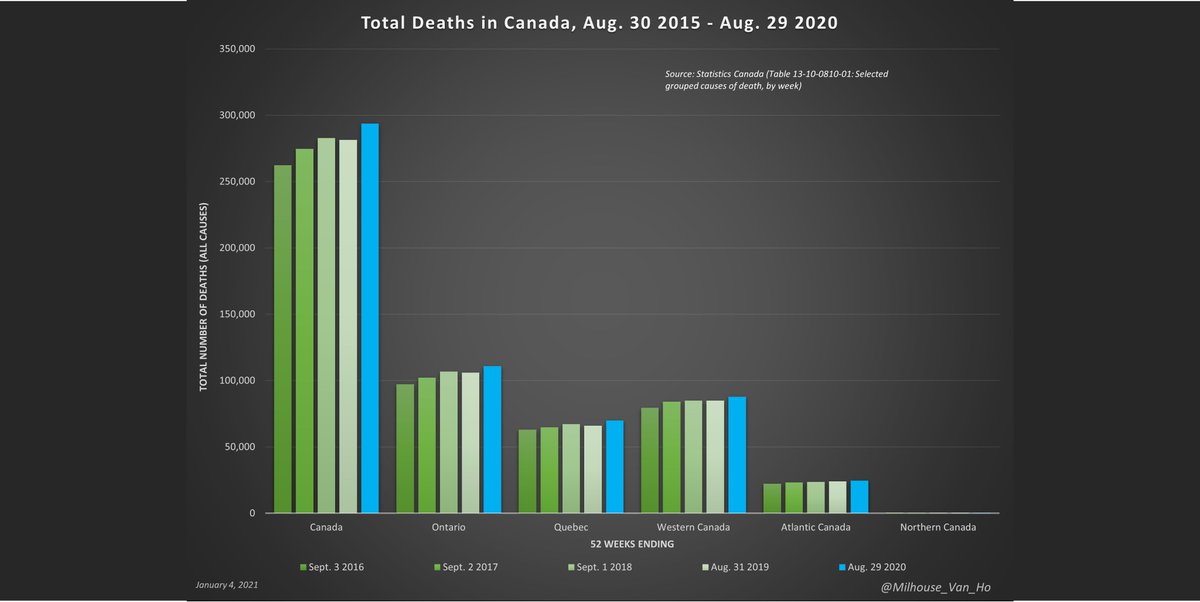
Here we have the total number of deaths in Canada over the past five years. The most recent 12 months of data do not suggest a spike in deaths out of line with historical trends.
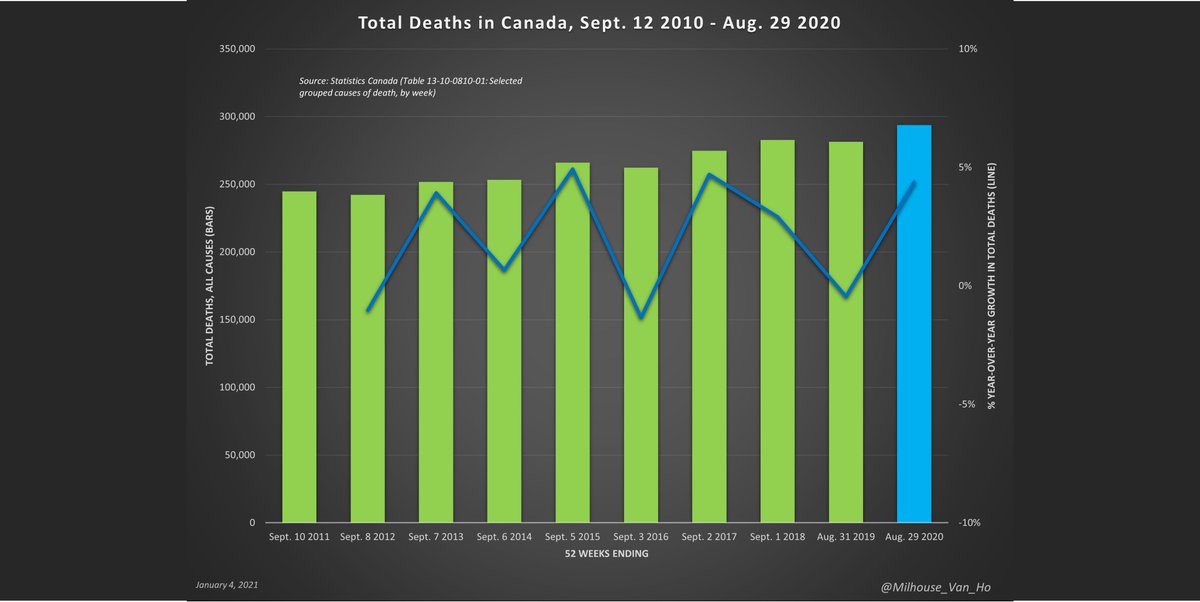
Zooming out nationally over the past decade, we see that it's perfectly natural for deaths in one year to exceed deaths in the previous year.

***This does not necessarily = excess deaths.***

Look how often the blue growth line is above 0%.
So deaths are rising.

Is that due to population growth?

Population aging?

It's a bit of both, but not covid.
Read 16 tweets
2 Jan
I sense that Michael is a good person at heart but hasn't seen the full picture. What data would you suggest to alleviate his concerns?
Michael, this is what I can suggest. I'd be happy to send links if you'd like to independently verify the source data.

@bobatyork Read up on Dr Gupta from Oxford.

reaction.life/we-may-already…
Read 6 tweets
1 Jan
I'll be starting a thread on the #inspirational political and entertainment leaders we have lost to #COVID19 in 2020.
RIP Erin O'Toole. Forever in our hearts.

RIP Tom Hanks and Rita Wilson. Gone but not forgotten.

news.com.au/entertainment/…
Read 23 tweets

Did Thread Reader help you today?

Support us! We are indie developers!


This site is made by just two indie developers on a laptop doing marketing, support and development! Read more about the story.

Become a Premium Member ($3/month or $30/year) and get exclusive features!

Become Premium

Too expensive? Make a small donation by buying us coffee ($5) or help with server cost ($10)

Donate via Paypal Become our Patreon

Thank you for your support!

Follow Us on Twitter!