
THREAD – Mortality 2020
Today we published England & Wales mortality statistics for the w/e 25 Dec
Nearly a full year’s data for 2020
In the last 52 weeks there were:
c.604k deaths registered across E&W
This is:
c.73k deaths (14%) above the 5-yr avg = excess deaths
1/11
Today we published England & Wales mortality statistics for the w/e 25 Dec
Nearly a full year’s data for 2020
In the last 52 weeks there were:
c.604k deaths registered across E&W
This is:
c.73k deaths (14%) above the 5-yr avg = excess deaths
1/11
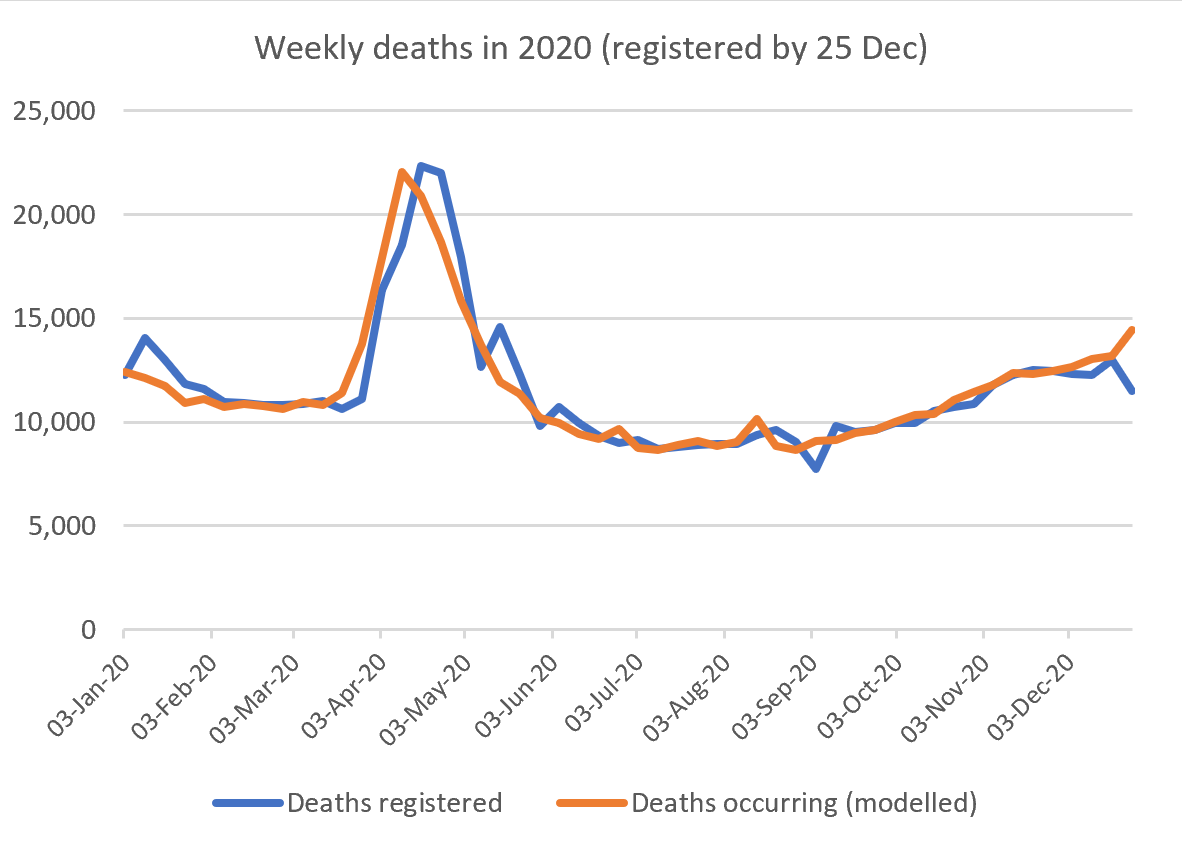
Remember the bank holiday effect which affects weekly figs
And the lag between deaths occurring and being registered
We now provide modelled estimates of death occurrences to remove these
The chart below shows both registrations and modelled occurrences across 2020
2/11
And the lag between deaths occurring and being registered
We now provide modelled estimates of death occurrences to remove these
The chart below shows both registrations and modelled occurrences across 2020
2/11
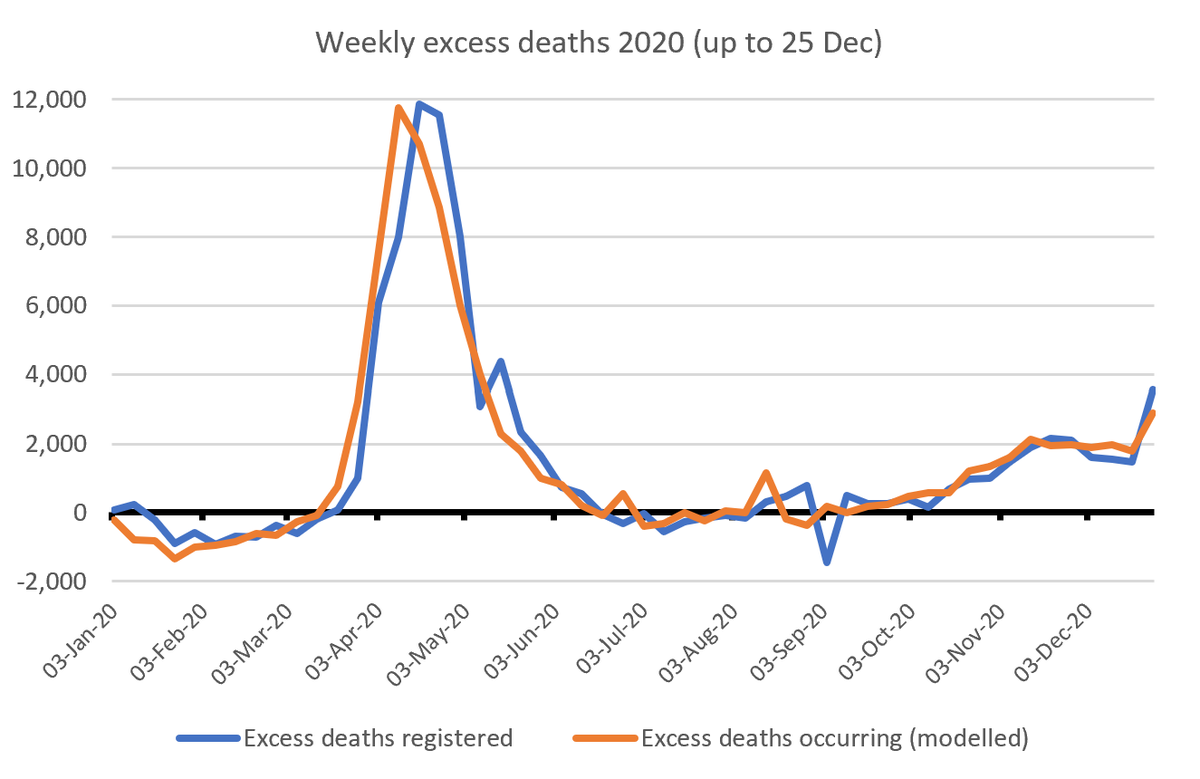
Looking at excess deaths, we began the year with death levels below the 5-yr avg
This was followed by a huge peak in the spring, driven by COVID, until lockdown1 took effect
Note the small Aug heatwave peak
And then a gradual pick up through autumn as CV took hold again
3/11
This was followed by a huge peak in the spring, driven by COVID, until lockdown1 took effect
Note the small Aug heatwave peak
And then a gradual pick up through autumn as CV took hold again
3/11
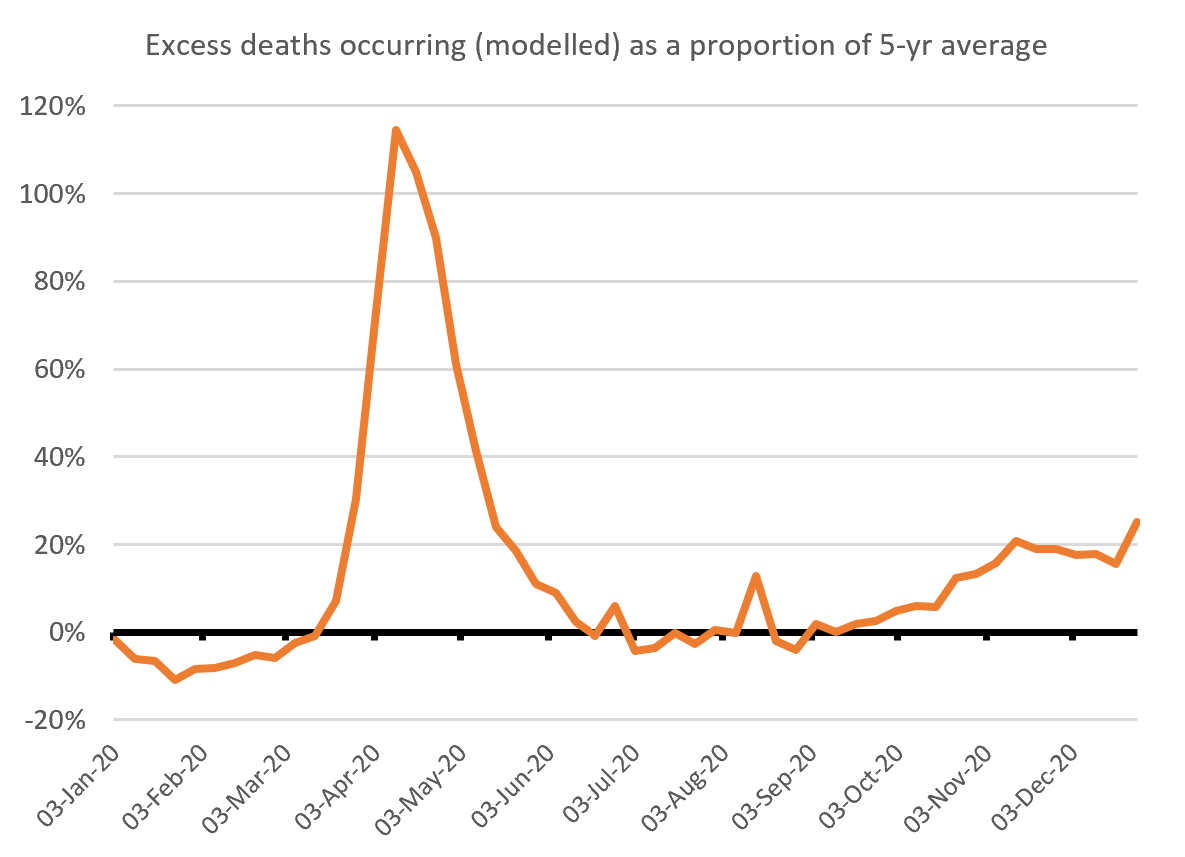
A seasonal effect means more deaths in winter than summer
The pattern of excess deaths as a % of normal weekly deaths is similar
There is a noticeable jump in the latest w/e 25 Dec
Given the recent alarming rise in CV infections this will increase further in Jan
4/11
The pattern of excess deaths as a % of normal weekly deaths is similar
There is a noticeable jump in the latest w/e 25 Dec
Given the recent alarming rise in CV infections this will increase further in Jan
4/11
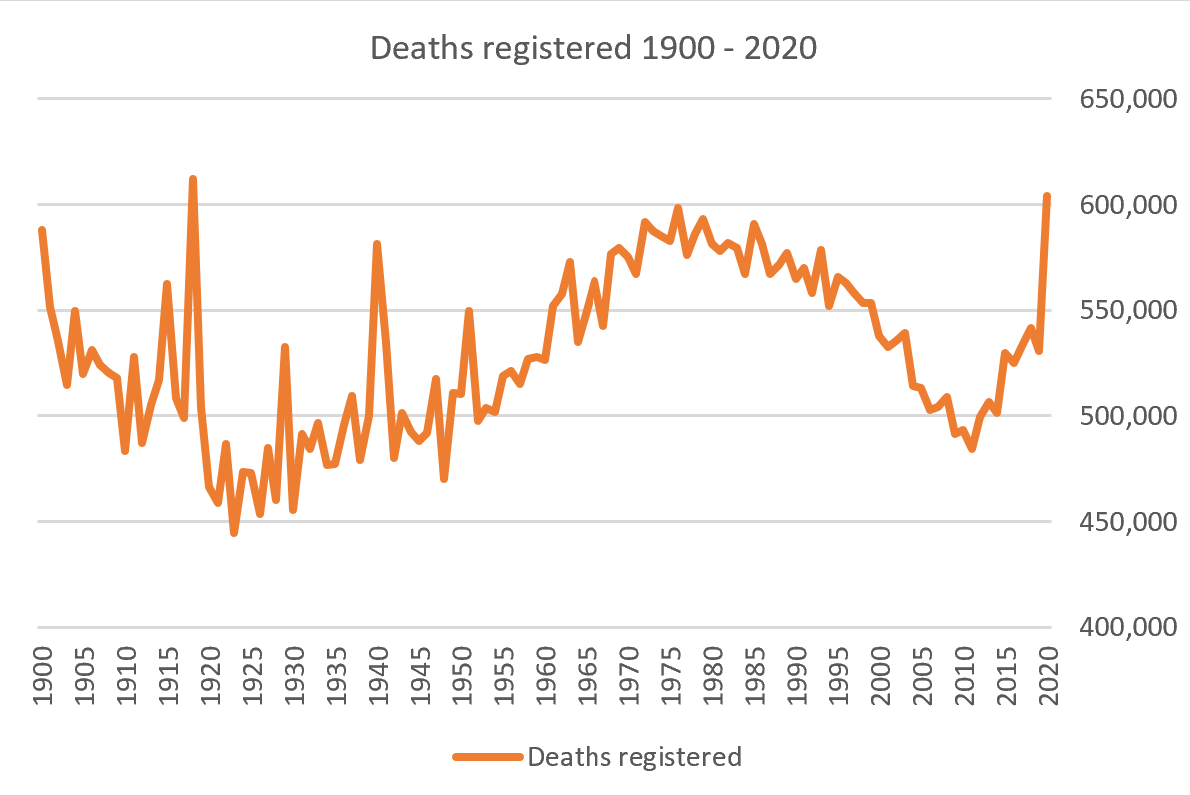
For longer term context we can compare annual deaths back to 1900
Deaths have been rising recently as life expectancy improvements have stalled, but the jump this year to over 600k is clear
Only one previous year has topped 600k – 1918, the year of the “Spanish” flu
5/11
Deaths have been rising recently as life expectancy improvements have stalled, but the jump this year to over 600k is clear
Only one previous year has topped 600k – 1918, the year of the “Spanish” flu
5/11
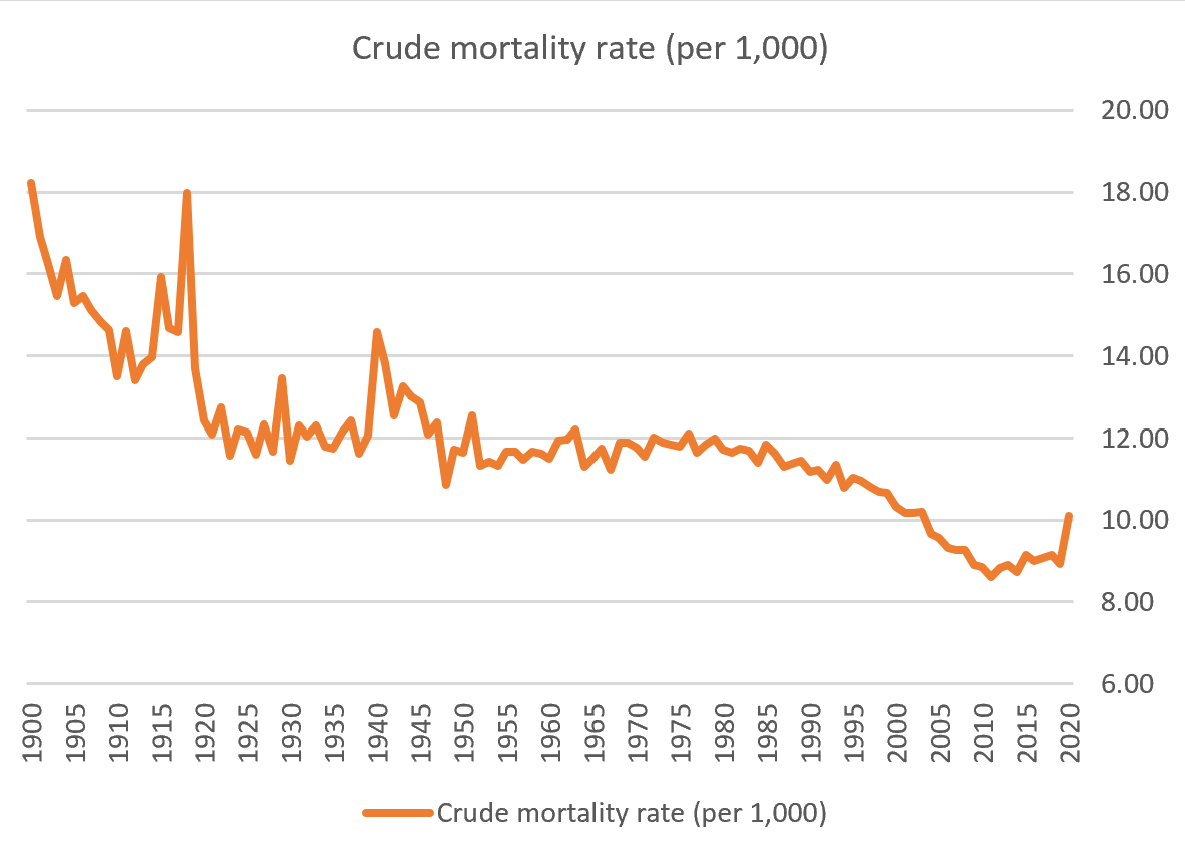
Numbers of deaths are affected by population size
We can also consider death rates – as a proportion of the population
“Crude” death rates are shown below
All improvements in the first decade of this century will be reversed this year
“Spanish” flu did the same in 1918
6/11
We can also consider death rates – as a proportion of the population
“Crude” death rates are shown below
All improvements in the first decade of this century will be reversed this year
“Spanish” flu did the same in 1918
6/11
Numbers of deaths are also affected by population structure, such as age. We will produce age standardised rates soon
Whilst the UK-born population is ageing, with post-war baby boomers now in their 50’s to 70’s, recent immigration will have predominantly been younger
7/11
Whilst the UK-born population is ageing, with post-war baby boomers now in their 50’s to 70’s, recent immigration will have predominantly been younger
7/11
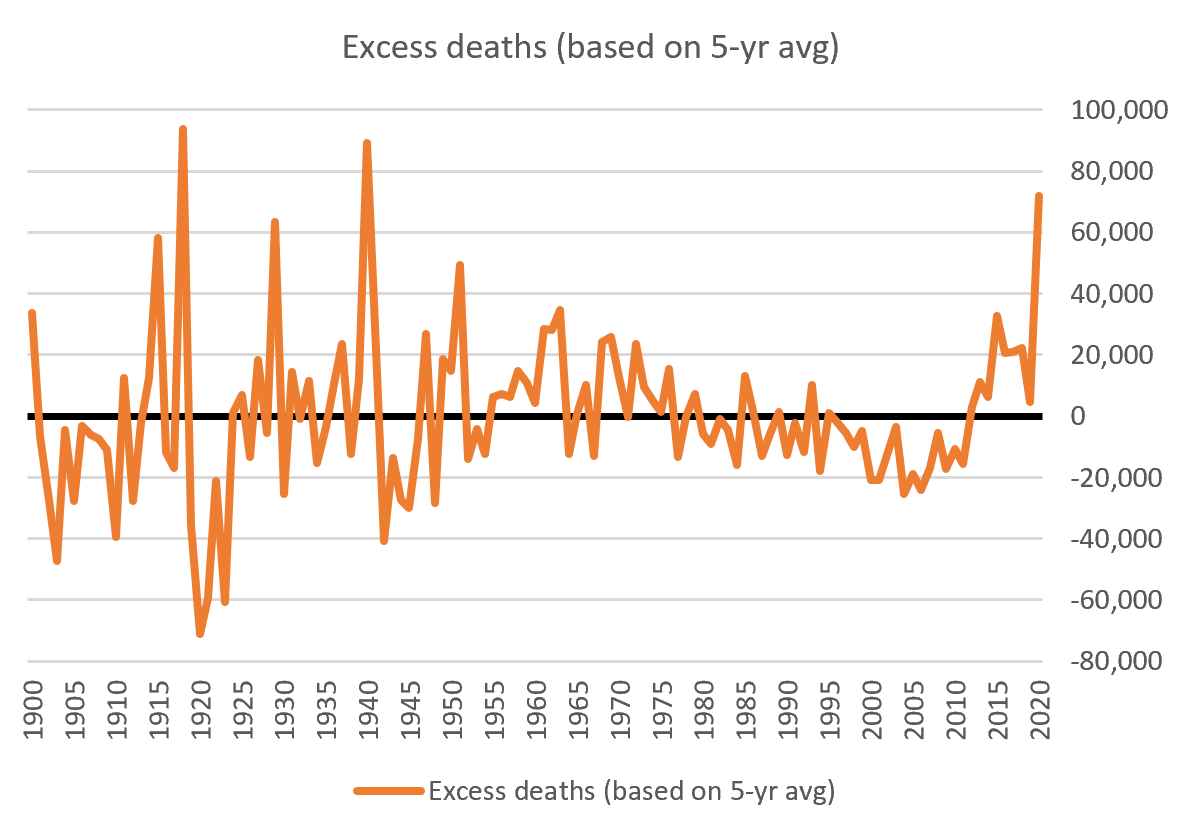
Our world changes too
Medical advances, the NHS, welfare state, better living conditions, all mean that 14% of babies do not die before their 1st birthday. They did in 1900
Excess deaths vs the last 5 years gives current context
This year will see the most since 1940
8/11
Medical advances, the NHS, welfare state, better living conditions, all mean that 14% of babies do not die before their 1st birthday. They did in 1900
Excess deaths vs the last 5 years gives current context
This year will see the most since 1940
8/11
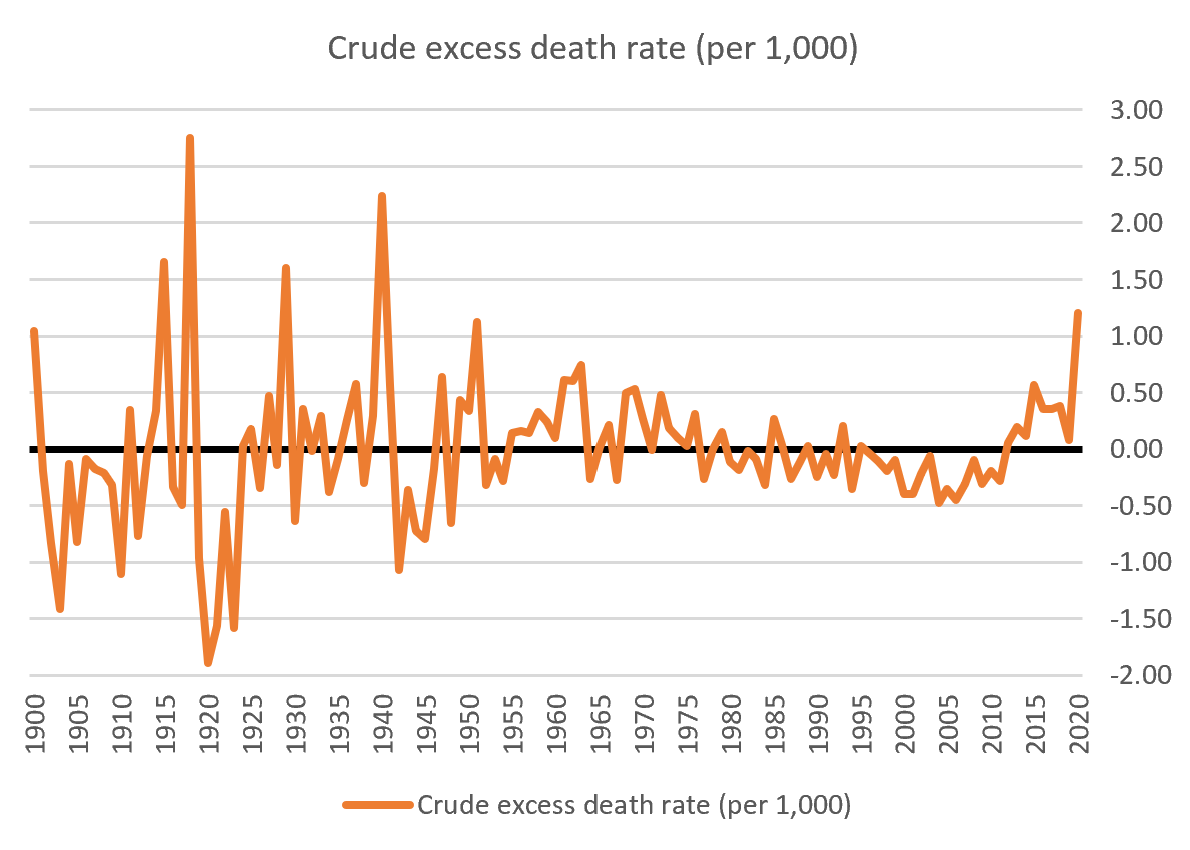
We can adjust by population to get crude excess death rates
2020 will also be the highest since 1940
Even with measures taken to limit COVID spread, 2020 will still top 1951, the year of a major flu epidemic
Without all our efforts, 2020 could have been much worse
9/11
2020 will also be the highest since 1940
Even with measures taken to limit COVID spread, 2020 will still top 1951, the year of a major flu epidemic
Without all our efforts, 2020 could have been much worse
9/11
A week is a long time in a pandemic
But the basic COVID logic remains the same 👇
Thank you to everyone caring for the sick in such difficult circumstances, you are heroes
My deepest condolences to all who have lost loved ones this year
10/11
But the basic COVID logic remains the same 👇
Thank you to everyone caring for the sick in such difficult circumstances, you are heroes
My deepest condolences to all who have lost loved ones this year
10/11
https://twitter.com/NickStripe_ONS/status/1344033059432255489
Thread on today’s figures from the main ONS account below 👇
Best wishes to all suffering with COVID today
And best wishes for an eventual recovery to all of you with Long COVID – I know how you feel
Stay safe and keep others safe
11/11 - ENDS
Best wishes to all suffering with COVID today
And best wishes for an eventual recovery to all of you with Long COVID – I know how you feel
Stay safe and keep others safe
11/11 - ENDS
https://twitter.com/ONS/status/1346751126637604864
• • •
Missing some Tweet in this thread? You can try to
force a refresh


