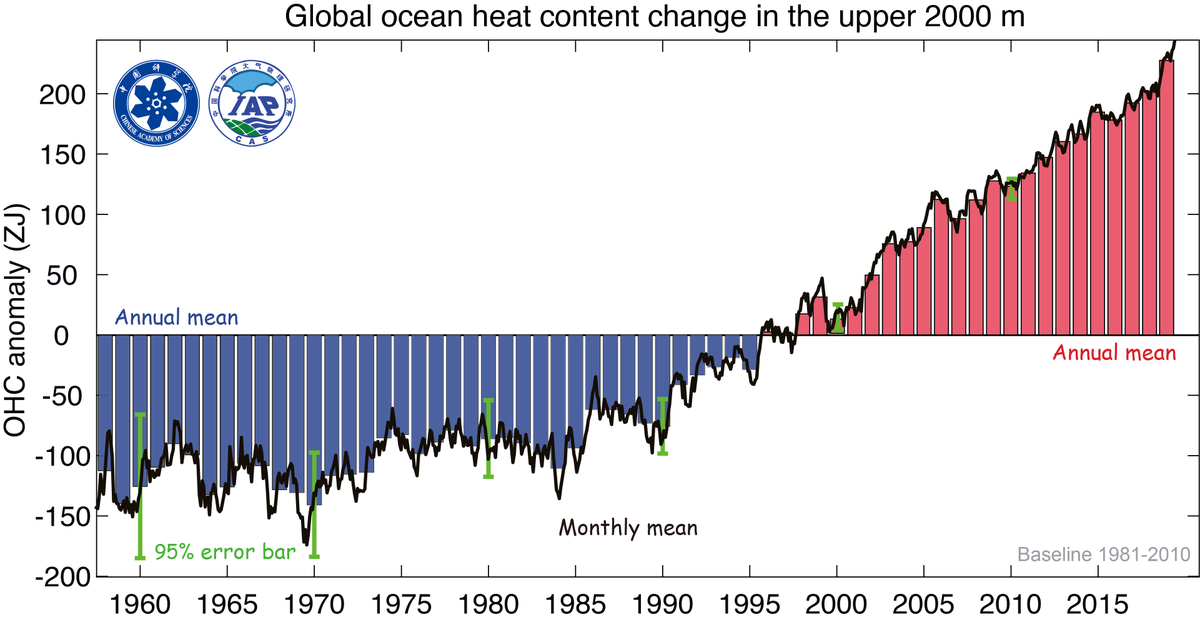
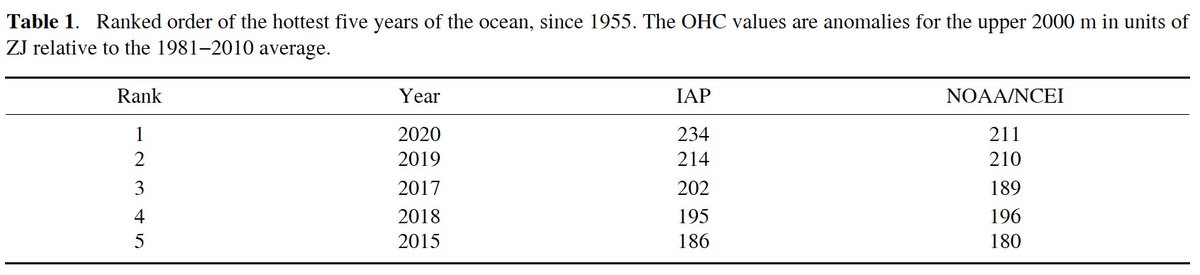
[1/8] 2020 ocean temperature (heat content) are formally released today by both IAP/CAS and NOAA/NCEI, both data show upper 0-20000m ocean heat content hit record high in 2020. With @MichaelEMann @jfasullo etc. link.springer.com/article/10.100…
[2/8] Differences between the 2020 OHC analyses between IAP/CAS and NOAA/NCEI reflect the uncertainties in the calculation due to method and data coverage. Further quantification of the uncertainties in OHC will help to better specify the confidence in OHC assessment.
[3/8] Over 90% of the excess heat due to global warming is absorbed by the oceans, and the heat has already penetrated into deep layers. Ocean warming is a direct indicator of global warming and the best measure of the Earth’s Energy Imbalance.
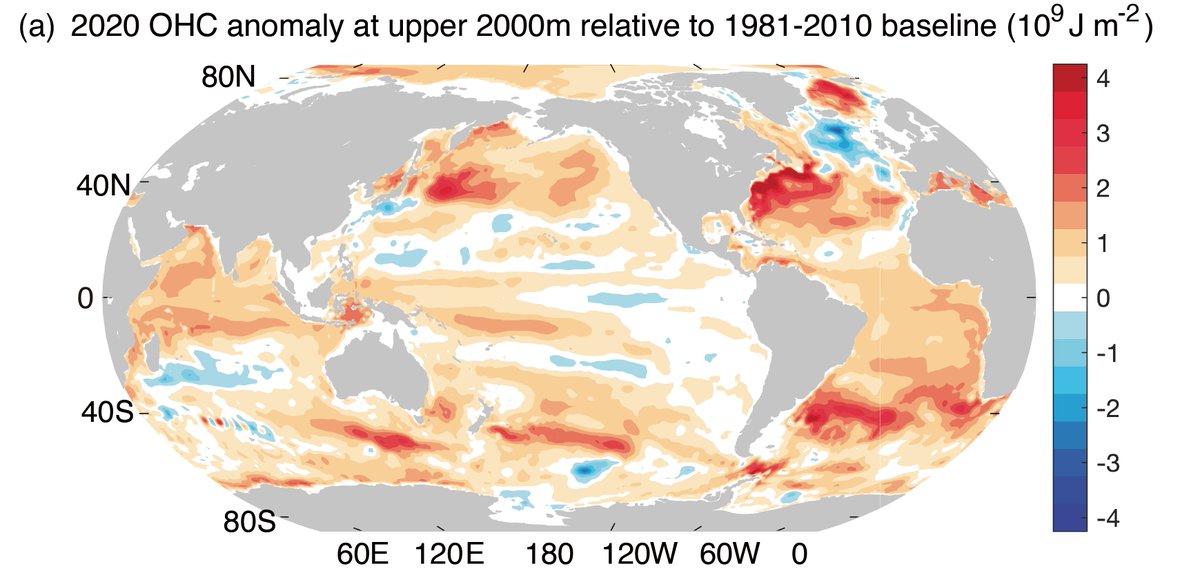
[4/8] The geo-pattern of 2020 OHC relative to 1981-2010 shows warming throughout most of the world’s oceans with higher rates of warming in both the northern and southern Atlantic (except southeast of Greenland), and in localized zones of the Pacific, Indian and Southern Oceans
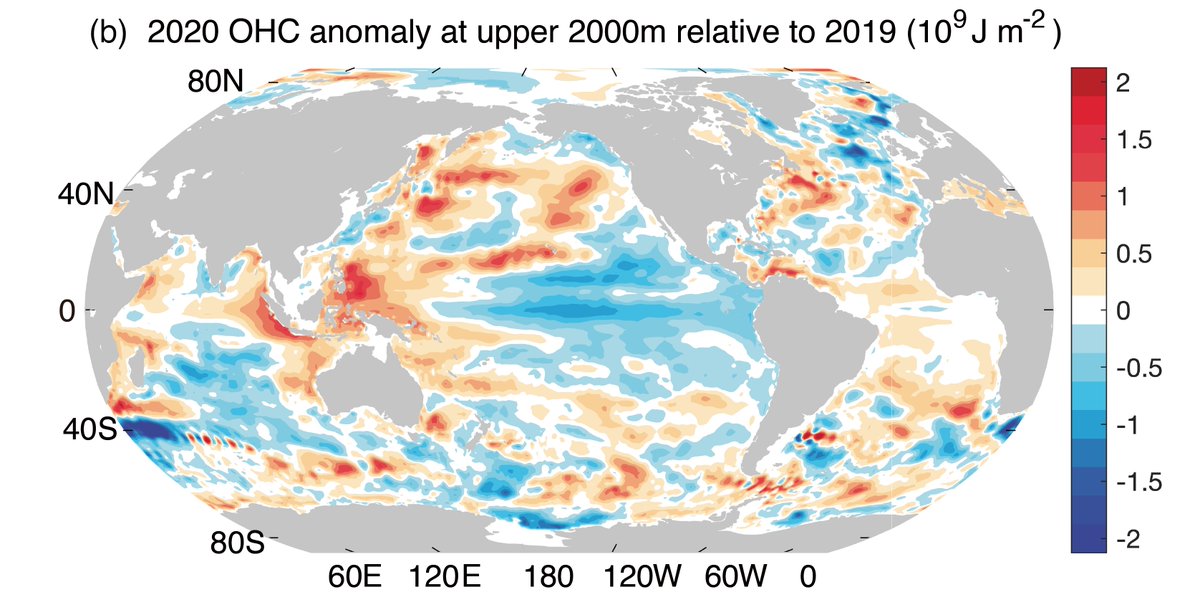
[5/8] W.r.t. 2019, the spatial pattern of 2020 OHC anomalies is much less distinct because internal variability can overwhelm long-term trends. Clearly ENSO causes the heat redistribution in the Pacific and Indian oceans. North Pacific warming 2020 supports marine heat waves.
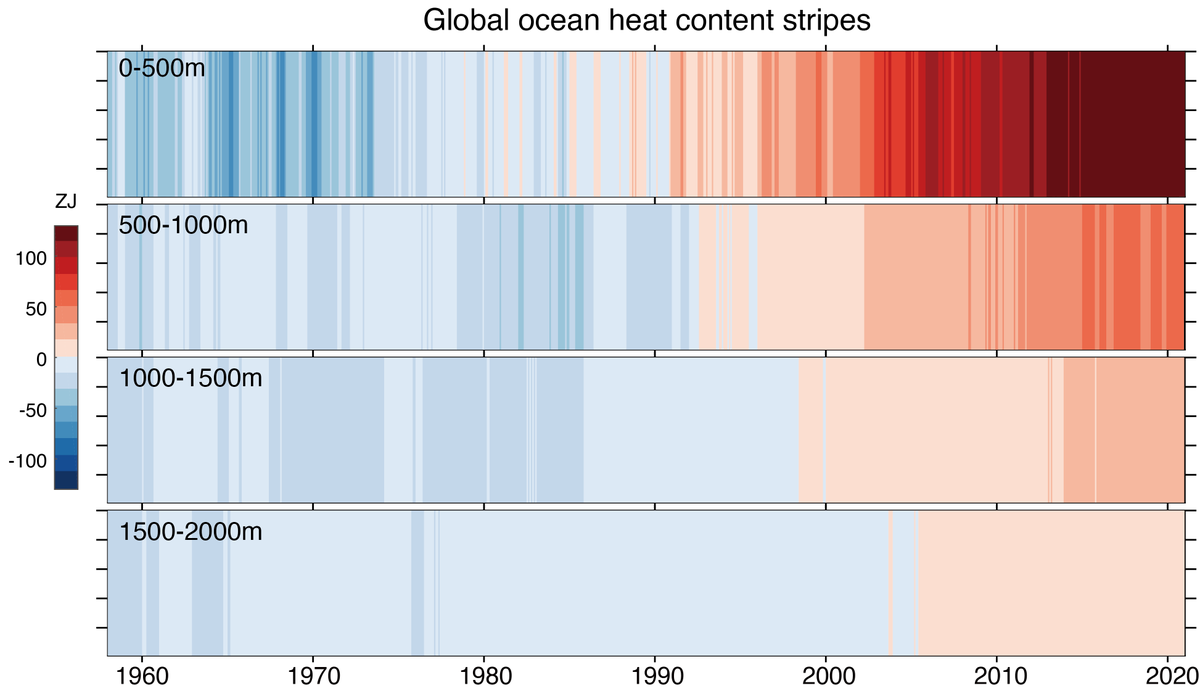
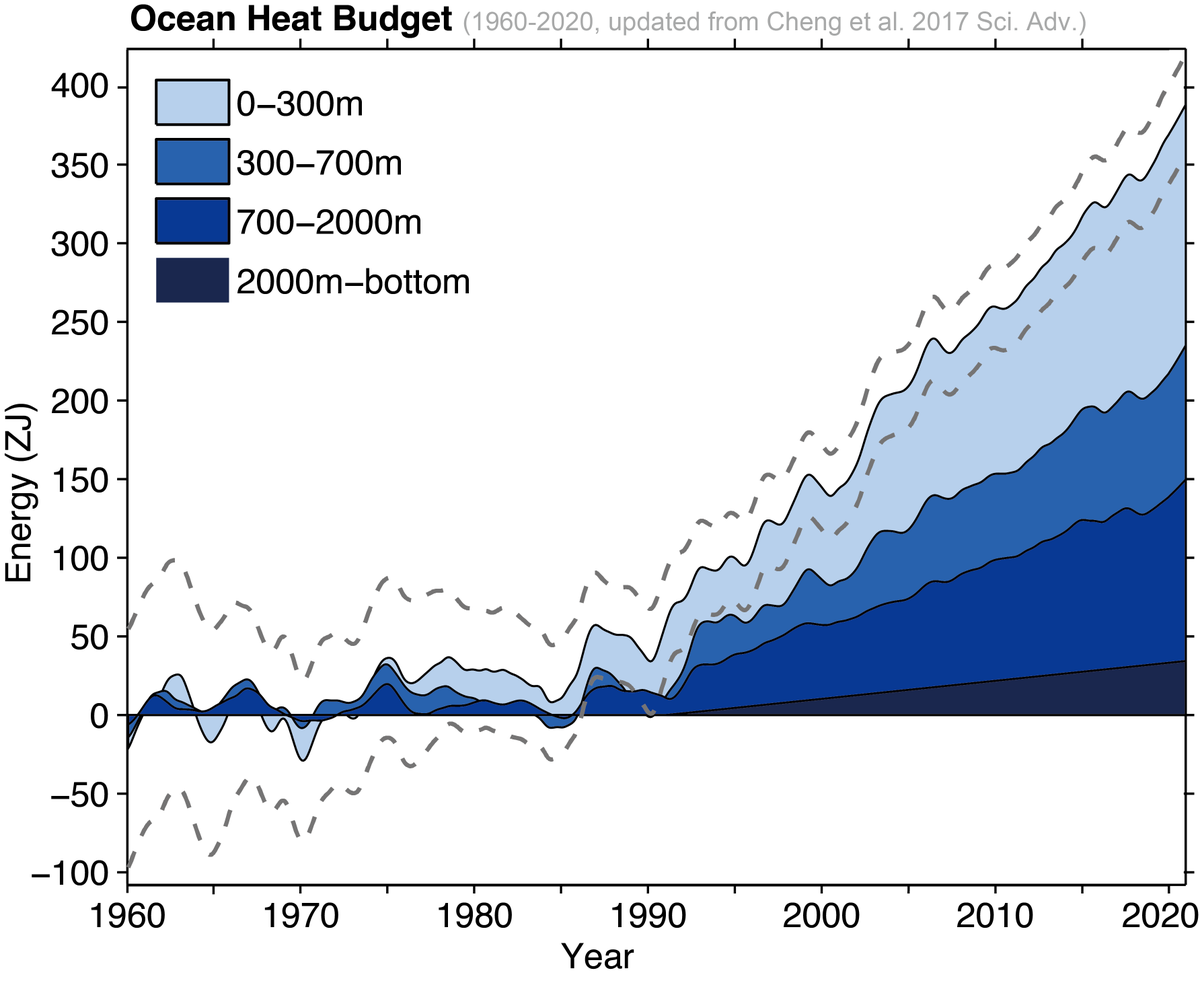
[6/8] Ocean heat budget update: a total full-depth ocean warming of 380 ± 81 ZJ (0.39 ± 0.08 W m^−2 over the global surface) from 1960-2020, with ~40.3%, 21.6%, 29.2% and 8.9% stored in the 0–300m, 300–700m, 700–2000m and below-2000m layers, respectively.
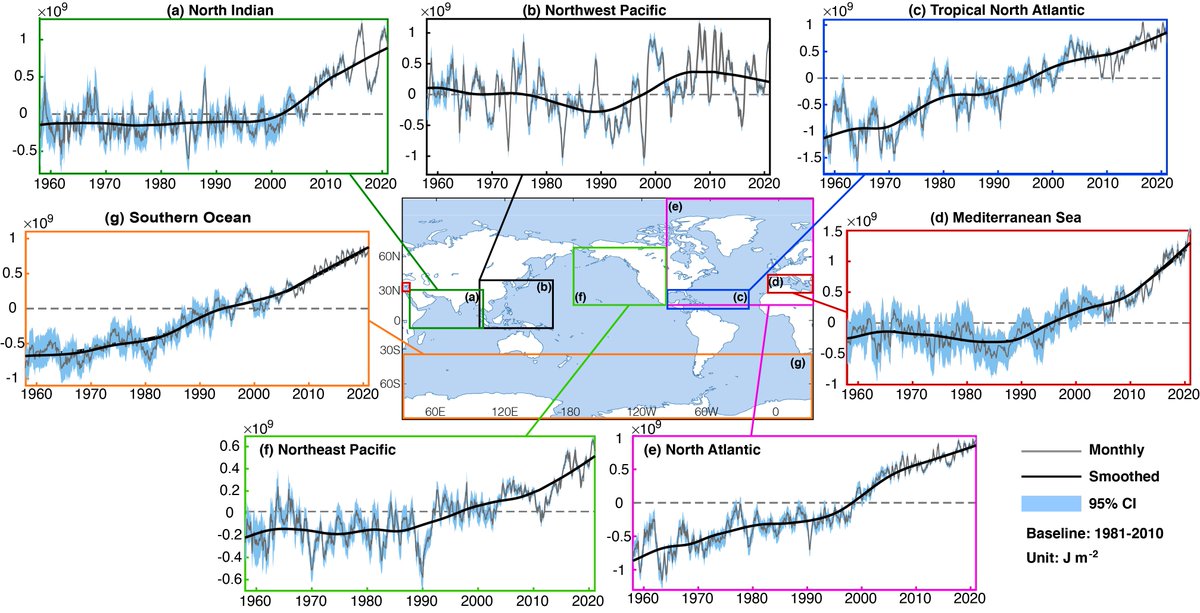
[7/8] Regional assessment is crucial to risk assessment and societal adaptation. In the tropical North Atlantic Ocean, where hurricanes generate and develop, OHC increases have been persistent since ~1958. The Mediterranean Sea, surrounded by 22 countries, is a hotspot of CC.
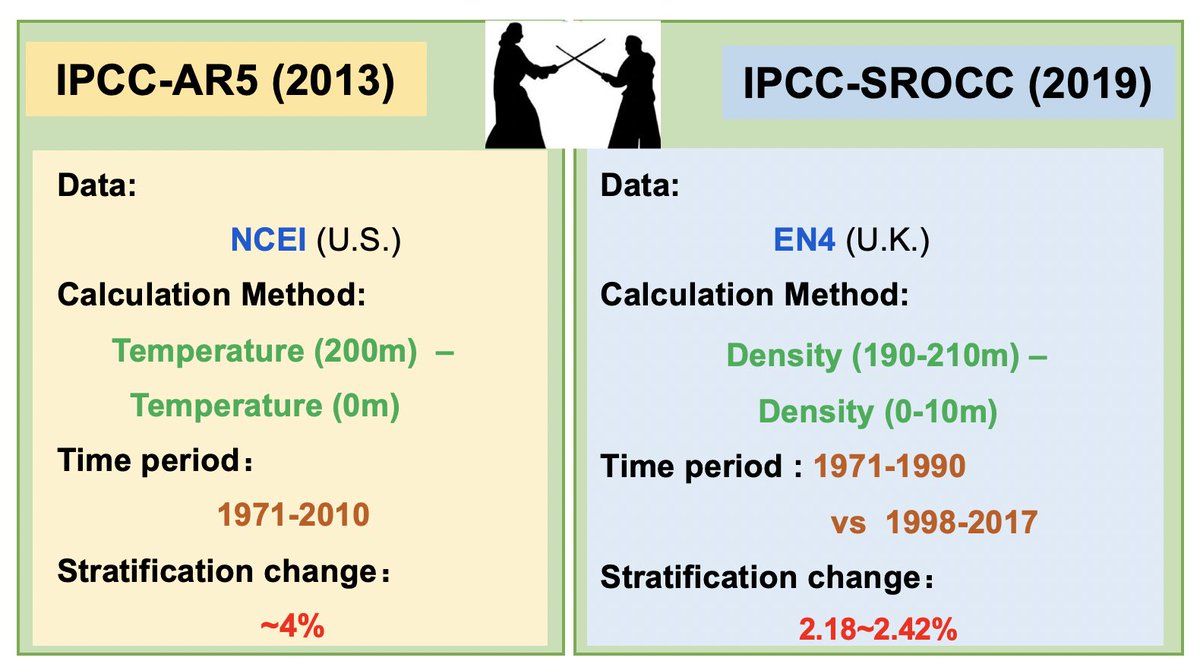
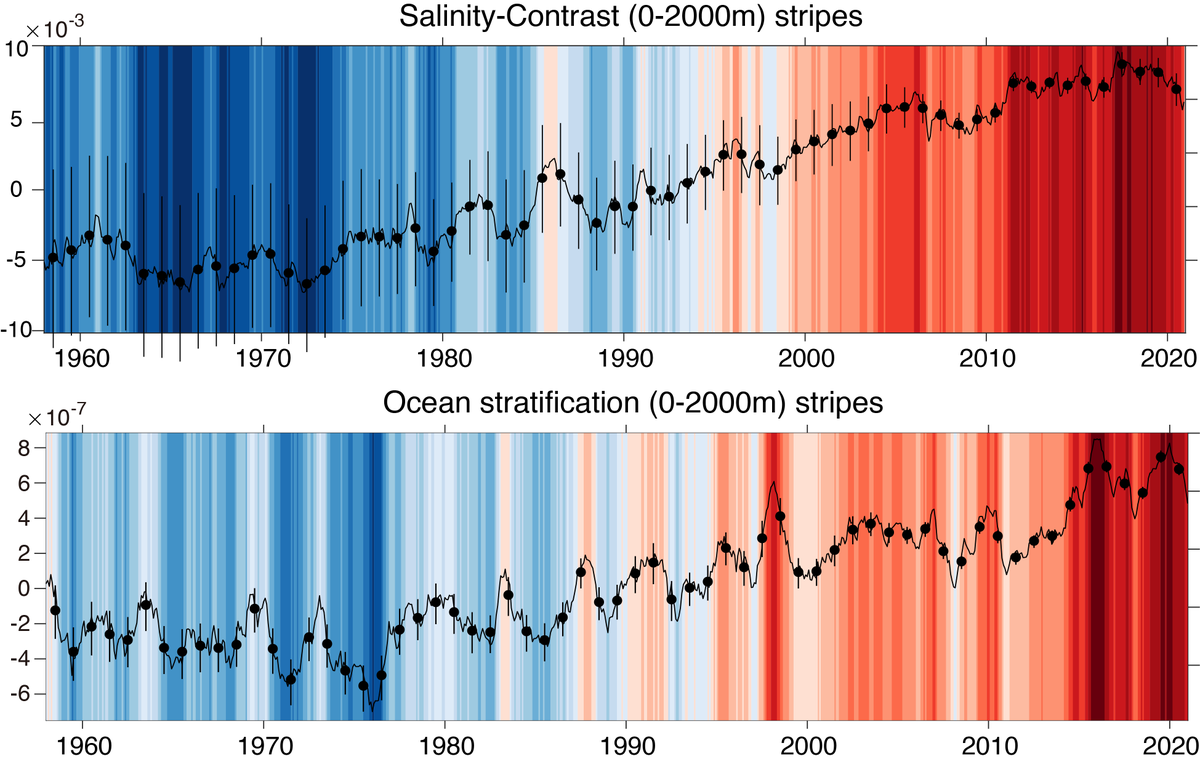
[8/8] The salinity-contrast increase trend (“fresh gets fresher, and salty gets saltier”) continues, indicating an acceleration of global water cycle. The ocean vertical stratification continues to increase, mainly caused by stronger ocean warming at upper layers than deep water.

• • •

Missing some Tweet in this thread? You can try to force a refresh
 

Keep Current with Lijing Cheng

Lijing Cheng Profile picture

Stay in touch and get notified when new unrolls are available from this author!

Read all threads

This Thread may be Removed Anytime!

PDF

Twitter may remove this content at anytime! Save it as PDF for later use!

Try unrolling a thread yourself!

how to unroll video
  1. Follow @ThreadReaderApp to mention us!

  2. From a Twitter thread mention us with a keyword "unroll"
@threadreaderapp unroll

Practice here first or read more on our help page!

More from @Lijing_Cheng

28 Sep 20
[THREAD 1/9] Please to introduce our new study published in Nature Climate Change: the global ocean has become more stratified and stable since 1960 with global warming: the ocean stratification at upper 2000m has increased by 5.3%. with @MichaelEMann nature.com/articles/s4155… Image
[THREAD 2/9] Sea water generally forms stratified layers with lighter waters near the surface and denser waters at greater depth (warmer waters atop colder ones). This configuration acts as a barrier to mixing that impacts the efficiency of vertical heat, carbon, oxygen exchanges Image
[THREAD 3/9] As human-caused greenhouse warming has altered oceanic temperature and salinity fields, impacts to stratification are expected but the details have been difficult to discern. An example is the different estimates in two recent IPCC reports Image
Read 9 tweets
9 Sep 20
[THREAD,1/9] Pleased to inform that our paper “Improved estimates of changes in upper ocean salinity and the hydrological cycle.” published. A new ocean salinity product is available and enables a new estimate on water cycle change. doi.org/10.1175/JCLI-D… @MichaelEMann @jfasullo
[2/9] The new IAP ocean salinity product covers global ocean (0~2000m, 41 levels; 1 deg. spatial resolution, monthly from 1960 to present). The spatial interpolation method is the same to our temperature data, uses the spatio-temporal co-variability of salinity from CMIP5 models. Image
[3/9] The new product is clearly more reliable for examining long-term salinity changes, as we show that this new salinity reconstruction has much better continuity through changes in the observing-system (from altimeters on satellites and profiling floats (Argo) in the ocean. Image
Read 10 tweets
14 Jan 20
[THREAD,1/9] Ocean heat content (0-2000m) data from IAP and NOAA/NCEI was just released, NO surprise, 2019 was the warmest year on record for global ocean. Not only that, the past 5/10 years are the warmest 5/10 years! [link.springer.com/article/10.100…]
[2/9] OHC is one of the key measure of global warming. Human activities emit greenhouse gases (i.e. CO2) into the air, which taps more and more heat in the climate system. Ocean stores more than 90% of the global warming heat!
[3/9] A updated ocean energy budget from 0m to ocean bottom shows a total full-depth ocean warming of 370 ± 81 ZJ (~0.38 ± 0.08 W m^−2) from 1960 to 2019, with contributions of 41.0%, 21.5%, 28.6% and 8.9% from the 0–300, 300–700, 700–2000m, and below-2000m layers, respectively
Read 9 tweets

Did Thread Reader help you today?

Support us! We are indie developers!


This site is made by just two indie developers on a laptop doing marketing, support and development! Read more about the story.

Become a Premium Member ($3/month or $30/year) and get exclusive features!

Become Premium

Too expensive? Make a small donation by buying us coffee ($5) or help with server cost ($10)

Donate via Paypal Become our Patreon

Thank you for your support!

Follow Us on Twitter!