Today I will be talking about some of the data structures we use regularly when doing data science work. I will start with numpy's ndarray.
What is an ndarray? It's numpy's abstraction for describing an array, or a group of numbers. In math terms, arrays are a "catch all" term used to describe matrices or vectors. Behind the scenes, it essentially describes memory using several key attributes:
* pointer: the memory address of the first byte in the array
* type: the kind of elements in the array, such as floats or ints
* shape: the size of each dimension of the array (ex: 5 x 5 x 5)
* strides: number of bytes to skip to proceed to the next element
* flags
The "stride" attribute here is key. it allows you to subset or view data *without* copying it, which saves time and space/memory. In this example, `x` and `y` share memory, even though they aren't exactly the same array! This is very helpful when working with "big data."
So this is why, if you've ever modified a slice of a numpy array, you end up modifying the original array!
The `stride` attribute is not only relevant when slicing arrays. Transposes, reshapes, and other operations take advantage of the `stride` attribute to avoid copying large amounts of data. Stay tuned for the next thread on vectorization.

• • •

Missing some Tweet in this thread? You can try to force a refresh
 

Keep Current with Women in Statistics and Data Science

Women in Statistics and Data Science Profile picture

Stay in touch and get notified when new unrolls are available from this author!

Read all threads

This Thread may be Removed Anytime!

PDF

Twitter may remove this content at anytime! Save it as PDF for later use!

Try unrolling a thread yourself!

how to unroll video
  1. Follow @ThreadReaderApp to mention us!

  2. From a Twitter thread mention us with a keyword "unroll"
@threadreaderapp unroll

Practice here first or read more on our help page!

More from @WomenInStat

13 Jan
Let’s talk vectorization! You may have heard about or experienced how simple NumPy array ops (such as dot product) run significantly faster than for loops or list comprehension in Python. How? Why? Thread incoming. Image
Suppose we are doing a dot product on two n-dim vectors. In a Python for loop, scalars are individually loaded into registers, and operations are performed on the scalar level. Ignoring the sum, this gives us n multiplication operations.
NumPy makes this faster by employing vectorization, where you can load multiple scalars into registers and get many products for the price of one operation (SIMD). SIMD — single instruction, multiple data — is a backbone of NumPy vectorization.
Read 8 tweets
7 Nov 20
During my leave I’ve really enjoyed reading about the inspiring women trailblazers in statistics who paved the way for us. Here are some of my favourite quotes in chronological order. Please share yours! #WSDS
Florence Nightingale states in her essay Cassandra 👇
🖼 source: Wikimedia commons Quote by Nightingale on women not being able to take occupat
Clara E. Collet writes in her chapter on women's work in Life and Labour of the People of London👇 (freely available to read: public-library.uk/dailyebook/Lif… )
🖼 source: facebook.com/SenateHouseLib… Clara Collet: life to large numbers of married woman... is n
Read 12 tweets
6 Nov 20
I’m really looking forward to attending this 👇 #Nightingale2020 has been one of the few things worth celebrating this year! Her lessons on sanitation couldn’t be more relevant.
#WSDS
As part of the bicentennary celebrations of the birth of the first @RoyalStatSoc woman elected fellow, at the society we’ve also organised several events throughout the year rss.org.uk/news-publicati… Florence Nightingale, Lady with the lamp, Polar area diagram
@RoyalStatSoc At @statsyss we were particularly proud to organise #FloViz,a #dataviz competition to reinterpret her famous polar diagram. The winning entries by @gunning_edward @sianbladon & Roddy Jaques 👇were announced on her birthday, you can see them: statsyss.wordpress.com/2020/05/13/flo… 3 reinterpretations of the polar area diagram, winning of th
Read 11 tweets
6 Nov 20
Support mechanisms for students and early career researchers have become ever so important during the pandemic, yet more difficult to provide.

🖼️Another beautiful and on-point creation by @allison_horst Four people supporting a trampolin to catch two baloons & co
@allison_horst As a consequence, the power and potential of the support they receive from online communities like this one have been strengthened by the circumstances. I have personally valued them more than ever.
@allison_horst When I registered to curate this account earlier in the year I didn’t know there was going to be either a pandemic or elections. I just thought it would be a nice way to return to work after extended maternal leave, and a great way to get my confidence & stats interests back.
Read 13 tweets
5 Nov 20
Throughout my career, I’ve become a bit wary of institutions that claim to be the best and specify exceptional candidates in job offers and PhD studentships…

(Shout-out to the great @Letxuga007 for the mean gif 😉)
I’d like to take this opportunity to demand the right for the less excellent or “tending towards average” to be given opportunities and have their well deserved place in Academia!

🖼️DIY creation using @allison_horst's fab artwork Distribution & average
This hyperbolic language is exclusionary and will not only deter the “average” student from applying but also very smart yet humble candidates who are perhaps more realistic and indeed honest in their self assessments 🤔
Read 7 tweets
28 Oct 20
Tweetorial on going from regression to estimating causal effects with machine learning.

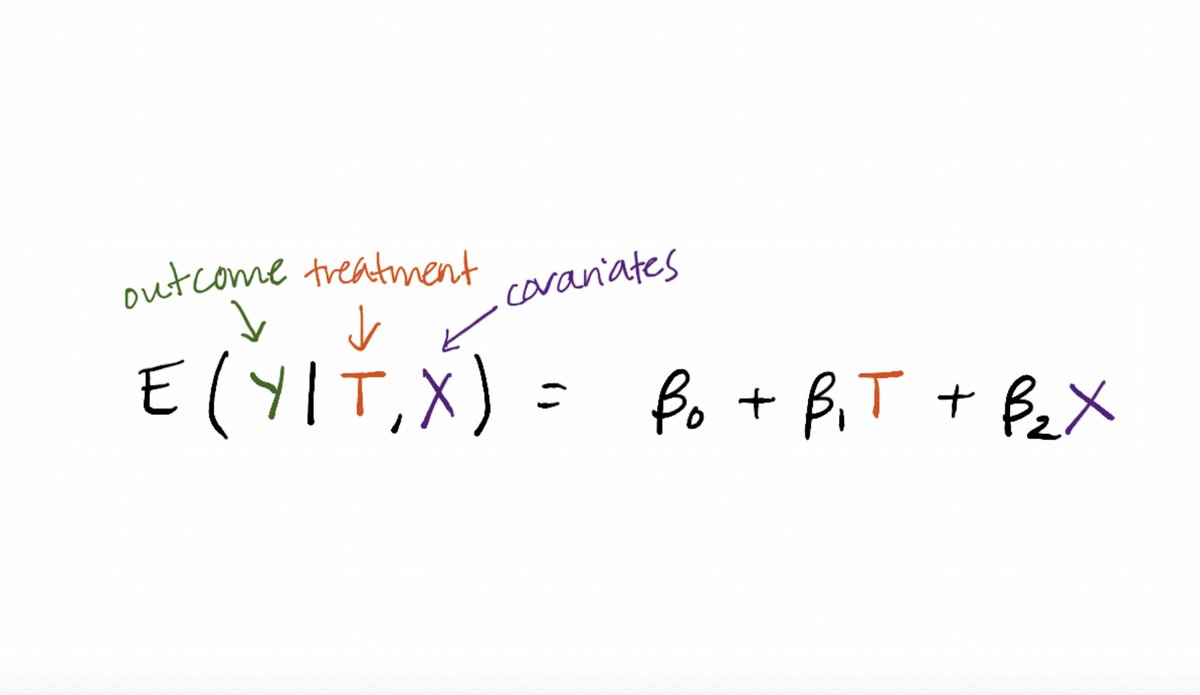
I get a lot of questions from students regarding how to think about this *conceptually*, so this is a beginner-friendly #causaltwitter high-level overview with additional references. Hand-drawn graphic of a regression formula E(Y|T,X)=\beta_0+
One thing to keep in mind is that a traditional parametric regression is estimating a conditional mean E(Y|T,X).

The bias—variance tradeoff is for that conditional mean, not the coefficients in front of T and X. Hand-drawn graphic of a regression formula E(Y|T,X)=\beta_0+
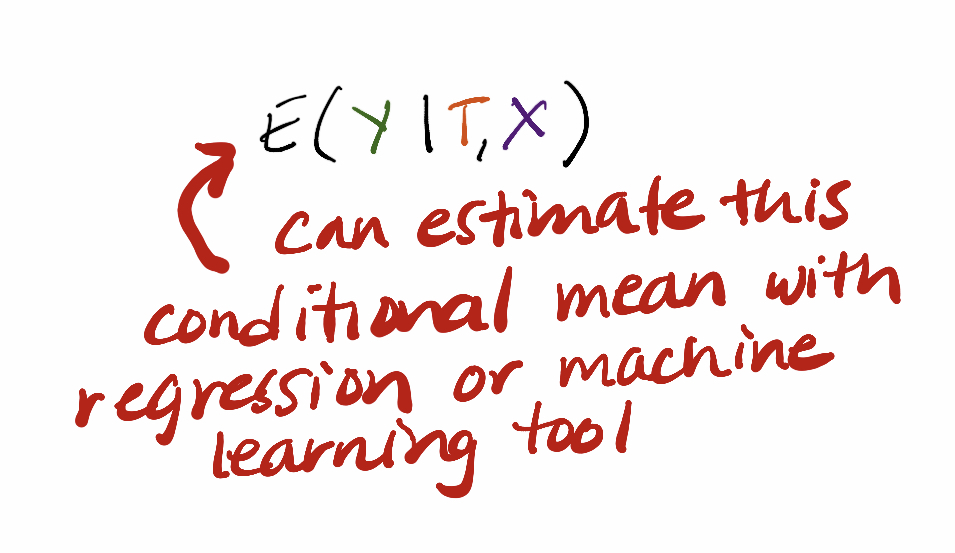
The next step to think about conceptually is that this conditional mean E(Y|T,X) can be estimated with other tools. Yes, standard parametric regression, but also machine learning tools like random forests.

It’s OK if this is big conceptual leap for you! It is for many people! Hand-drawn graphic of the conditional mean E(Y|T,X) with red
Read 13 tweets

Did Thread Reader help you today?

Support us! We are indie developers!


This site is made by just two indie developers on a laptop doing marketing, support and development! Read more about the story.

Become a Premium Member ($3/month or $30/year) and get exclusive features!

Become Premium

Too expensive? Make a small donation by buying us coffee ($5) or help with server cost ($10)

Donate via Paypal Become our Patreon

Thank you for your support!

Follow Us on Twitter!