#bajajfinance#Q3marketupdates Q3 FY21 highlights
New loans booked 6.04/7.67 mn Q3fy20
Customer franchise Q3fy21 46.31 vs 40.38 mn 31 Q3fy20 Company acquired 2.19 mn new customers in Q3fy21 vs 2.46
mn Q3 FY20.
AUM 31 Dec 20 143,550 cr vs 145,092 crore as of 31Dec 19.
Liquidity surplus Q321 14,347 cr vs 11 ,384 cr Q320 Cost of liquidity surplus for Q3 FY21 was ~ 213 crore vs ~ 83 crore in
Q3 FY20
NII for Q3 FY21 ~ 4,296 vs ~ 4,535 cr Q3 FY20
NII for
Q3 down 239 cr vs Q3 20, due to higher
reversal of interest income & cost of liquidity
PAT Q3 FY21 1146 vs 1614 crore in Q3 FY20
GNPA ,NNPA as of Q3fy20 0.55% & 0.19% vs
1.61% & 0.70% Q3fy20
PCR Q3fy20 65%
Capital adequacy ratio (including Tier-II capital) Q3fy20 28.18%
Bajaj finance to launch Bajaj pay in Q4
Integrated payment solution of UPI,PPI,EMI card ,credit card
Also Bajaj pay for merchants, has 103K merchants on board
Building 5 proprietary market places
EMI store
Insurance
Investment
BF Health
Broking app #BajajFinance
• • •
Missing some Tweet in this thread? You can try to
force a refresh
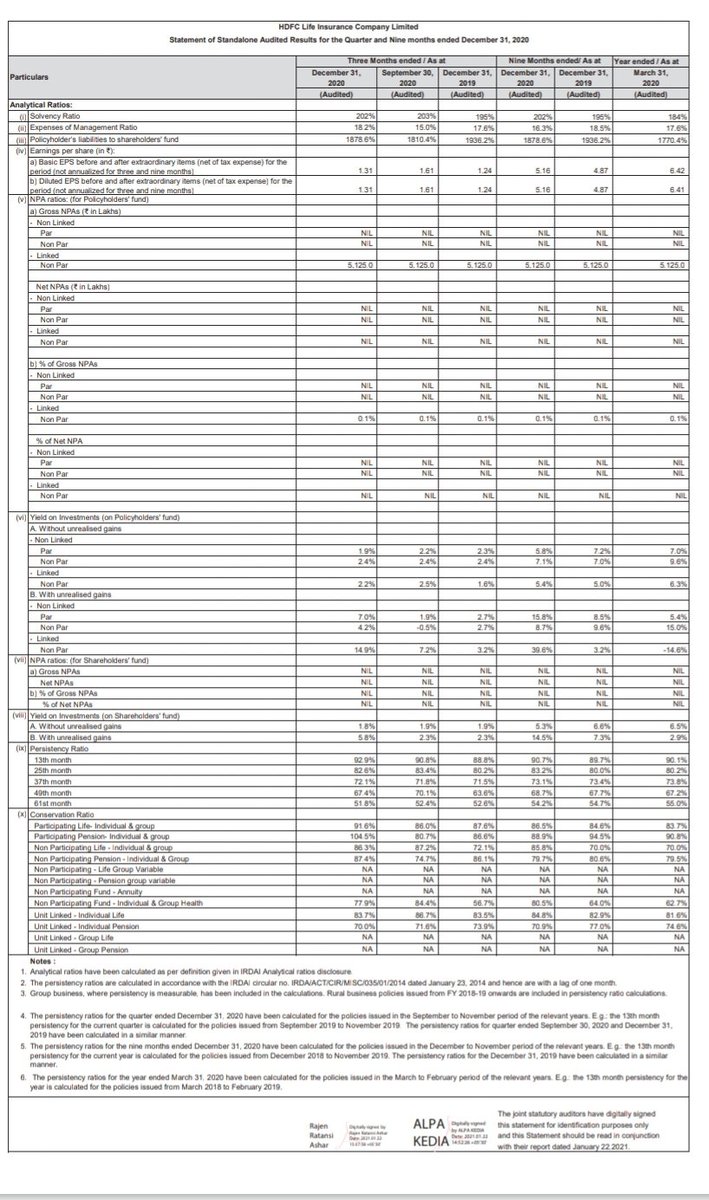
Mkt share up 214 bps to 16.4%
NBM at 25.6%
8% Individual WRP growth compared to private industry de-growth of 6%
25.6% New Business Margin on the back of growth, balanced product mix
17% growth in Protection (Indl) and 42% growth in Annuity in APE terms
22% growth in renewal premium with stable persistency
PAT of Rs 1,042 Cr, with growth of 6%
Solvency healthy at 202%
Pvt mkt share rank up to 2,gain 214 bps 14.3 to 16.4%
Balanced product mix %
Savings 35
Non participating savings 30
Ulips 23
Protection 7
Annuity 5
Fy21 guidance
Revenue expected to grow QoQ betn 2-3% in constant currency for Q4fy21
Ebit exptd to grow betn 21-21.5% for fy21
Rev cross $10bn milestone in Cy20 ,delivering 3.6% yoy growth in constant currency, CY20 delivered Ebidta 26.6%,ebit 21.5%
#hcltech won 13 transformational deals across industry vertical including lifesciences,healthcare ,tech, financial services
Broad based growth driven by Mode 2 & products & platforms
Mode 2 prime driver of growth, up 25% yoy & 10.9% wow in CC,led by traction in cloud& digital
Products & platforms clocked healthy 9.3% yoy growth in CC on strong new license sales & robust renewals
Ebidta at 28.2% expanded 355 bps yoy
Ebit 22.9% expanded 265 bps yoy,129 bps QoQ
Cy20 operating cash flow $2667 mn & FCF $2407 mn ,up 63.5 & 82.8% yoy
Loan book increased 16% YoY to 10.82 lakh crs & deposits by 19% YoY to 12.71 lakh crs at the end of Dec 20
CASA Dec 20 43% vs 39.5% Dec 19 & 41.6% Sep20
Provisions 3414 cr vs 3703 qoq vs 3043 crs yoy
Gross NPA 8825 crs (0.81 vs 1.08) vs 11305 qoq, down 21.9 % ,down 189 bps
Net NPA 1016 vs 1756 ( 0.09 vs 0.17% ) down 42% qoq ,down 8 bps
Restructuring under Covid 0.5% of advances
5485 vs 5203 branches yoy
15541 vs 14533 ATMs
CAR at 18.9% against regulatory requirement of 11.075%
Total credit cost ratio 1.25% vs 1.41% Q2fy20 vs 1.29% Q3fy20
Balance sheet size 1654226 cr vs 1395336 Q3fy20
#gtpl hathway investor presentation highlights #Q3marketupdates
No.2 MSO India
No.1 in Gujarat, 67% mkt share
No.6 Pvt wireline broadband player
CATV subscriber base 1.8x last 4yrs,Broadband base up 2.3x
Rev CAGR 22% last 4 yrs ,Ebidta Cagr 18%
FCF + last 4 yrs #StockMarket
Dividend paying last 4yrs ,30% dividend Fy20
Net debt 392 mn Dec 20 ,down 3511 mn last 4 yrs
Repaid debt 972 mn in last year
Total income (Incl EPC) up 12%QoQ
ISP rev up 84% you
Ebidta 4170 mn in 9Mfy21 ,up 10%
PAT 1314 mn in 9mnths, up 45%
CATV Business
Increased active & paying subscribers 50K each QoQ basis
Broadband increase 185K subscribers in 9mfy21 ,55k in Q3
Active subscribers 590K Q3
5.5% increase in ARPU
Avg data consumption per user 205 GB Dec 20,up 63% annually