@HDFCLIFE #Q3marketupdates #Q3investorpresentations

Mkt share up 214 bps to 16.4%
NBM at 25.6%
8% Individual WRP growth compared to private industry de-growth of 6%
25.6% New Business Margin on the back of growth, balanced product mix
17% growth in Protection (Indl) and 42% growth in Annuity in APE terms
22% growth in renewal premium with stable persistency
PAT of Rs 1,042 Cr, with growth of 6%
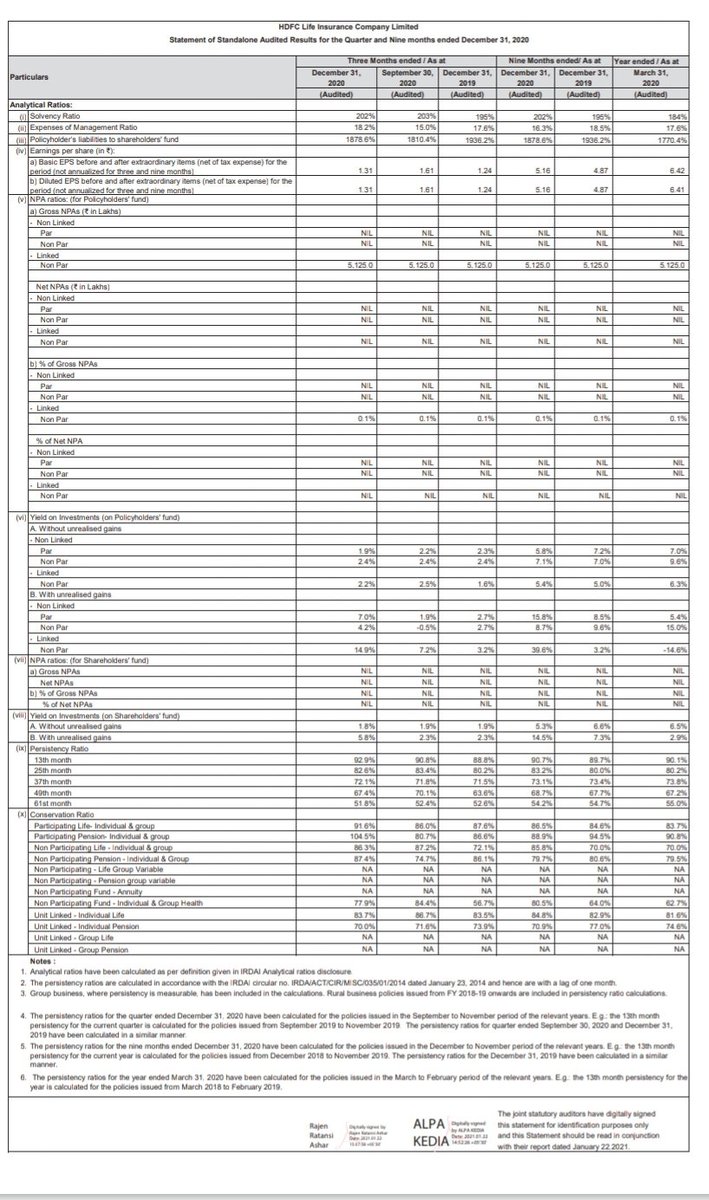
Solvency healthy at 202%
Pvt mkt share rank up to 2,gain 214 bps 14.3 to 16.4%
Balanced product mix %
Savings 35
Non participating savings 30
Ulips 23
Protection 7
Annuity 5

Distribution 300+ partners

AUM 31Dec 20
1.7 lkh cr
Debt:equity mix 64:36
98% debt in Gsecs & AAA

Renewal premium growth 22%
NBM 25.6%
PAT 10.4 bn,up 6%
Solvency ratio 202%
42 % growth in annuity business

NBM %
2019 24.6
2020 25.9
9 months fy21 25.6

Strong partner ships
Hdfc bank ,Yes ,RBL , pnb housing ,Idfc 1st
etc

Sustained growth in Individual protection %
2018 2.5
9mnth fy21 3
NPS - #1 with AUM 139 bn amongst pvt players ,strong growth AUM 9mnths 81%

26000 lives covered in 9mnths Fy21

5 building blocks
Insta suite
InstaInsure
Online payments & services
AI ,Big data ,Cloud
Life 99
Life insurance penetration %
Taiwan 16.5
Hong kong 18.3
Japan 6.7
China 2.3
India 2.8

Life insurance density US$
Hong kong 8979
Taiwan 4129
Japan 2691
China 230
India 58

Indias insurable population to touch 750 mn 2020
Elderly population to double 2035
Protection gap 2019
India 83%
China 70
Singapore 55
Hong kong 41

Protection gap growth rate to grow 4% per annual

Retail credit growth CAGR 18% last 10 yrs,retail indebtedness to spur need for credit life products

Only 1 out of 40 people who can afford buying insurance
Indias pension mkt is under penetrated at 4.8% GDP
Increased life expectancy to lead to avg retirement period of 20 years
60+ population to triple by 2050
Total pension AUM to grow to 47 trillion by 2025
Mandatory schemes to increase coverage for org & unorganized sectors

• • •

Missing some Tweet in this thread? You can try to force a refresh
 

Keep Current with TheMarket🐝

TheMarket🐝 Profile picture

Stay in touch and get notified when new unrolls are available from this author!

Read all threads

This Thread may be Removed Anytime!

PDF

Twitter may remove this content at anytime! Save it as PDF for later use!

Try unrolling a thread yourself!

how to unroll video
  1. Follow @ThreadReaderApp to mention us!

  2. From a Twitter thread mention us with a keyword "unroll"
@threadreaderapp unroll

Practice here first or read more on our help page!

More from @BullsforBears

23 Jan
@PolycabIndia #Q3marketupdates #Q3investorpresentations

Q3 earnings presentation
Revenue Q3 27988 mn ,up 12% yoy
9m 58891 mn ,up 12% yoy
PAT 2636mn ,up 19% yoy
9m 6027 mn,up 9% yoy
Net cash Q3 - 1335 mn Image
Wires&cables
6% yoy growth
Distribution channel double digit growth
Institutional businesses continues 2 face headwinds
Wires > cables
Housing wires strong momentum
Export 2.9 bn,10.5% overall sales,down 33% yoy due higher Dangote base
Exc Dangote, Aus,Asia,UK 29% yoy growth
Fast moving electrical goods
Strong 41% yoy growth in total Rev back of consumer demand,distribution, product mix
FMEG mix to sales up 215bps, up 10.8% yoy
Fans took leadership in few geographies
Segment Ebit margin 5.9% in Q3 & 4.7% in 9mnths
Read 10 tweets
23 Jan
@LTI_Global #Q3marketupdates
Conf call highlights
Seeing good traction in BFSI,Media,CPG Retail,Pharma,Mftg services
2large deal wins in Q3fy21 of $278 mn
$204mn Injazat deal in Dec 20 in UAE ,for high tech vertical, to help in cloud adoption ,best shoring ,ERP modernization
$74 mn deal with a Fortune 500 energy company
Injazat & energy deal revenues to contribute numbers from Q1fy22
Healthy margin growth of 35 bps led by higher utilization, increased offshoring, optimisation in SG&A
- wage hike in Q4 to impact numbers,160 to 170 bps
Offshore utilization due to higher growth, manag confident of maintaining onsite at past levels
Investment in SG&A ,Nordics ,data products to drive margin growth going fwd
PAT guidance of 14 to 15% going fwd
Digital business now contributes 44% to revenues, up 9.5% QoQ
Read 4 tweets
22 Jan
#glandpharma
#Q3marketupdates #Q3investorpresentations
Good show inr in mn
Rev 8945 /6712
PAT 2041 /1540
EPS 12.83 /9.95

9 months fy21 /20
Rev 26626 /20909
PAT 7365 /5780
EPS 47.12 / 37.31

Mkt wise
US 6021 /4853
India 1495 /1193
ROW 1078/413
R&D expenses INR Mn
Q3 fy21 434
Q3fy20 312
9M Fy21 916
9m Fy20 749

Net worth INR Mn
Mar 20 36462
Dec 20 56221

Net cash INR Mn
Mar 20 13202
Dec 20 28128

Capital expenditure
9M Fy20 1342
9M Fy21 1826

CFO
9M Fy20 4244
9M fy21 4056
New launches
9months fy21 - 31 product SKUs (4 mols)
US mkt - Dec 20 ,with partners filed 282 ANDAs, 226 approved, 56 pending

Core mkts (US,EU,Canada,Australia)
9M fy21 17415 mn
Growth 20%
Q3 fy21 6021 mn
Growth 24%

Domestic MKT
9M fy2110 product SKUs
Started Remdesivir mftg
Read 10 tweets
21 Jan
@SyngeneIntl #Syngene #Q3marketupdates
Q3fy21/20 in mn
Rev 5845 /5191
Ebidta 1933 /1735
PAT 1022 /918

9months fy21 /20
Rev 15257/14046
Ebidta 5026/4749
PAT 2443 /2460
Q3fy20 had exceptional gain of 459 mn leading to higher PAT

Good show
High conviction bet
Doubler for me
#Q3investorpresentations

Collaborated Deerfield discovery & development 3DC to advance integrated drug discovery projects, early target validation to preclinical evaluation

Expanded research facility Genome valley Hyderabad, +90 scientist

Accreditatn NABL fr medical devices
Setup new RT-PCR testing facility approved by NABL & ICMR

360clients
20395 mn Rev Fy20
8 Collaborations with top 10 pharma companies
4200 + scientists
3662 mn PAT fy20
400+ patents ( held with clients )
31541 mn capex Mar 20

Integrated services- drug discovery,development,mfg
Read 10 tweets
20 Jan
#bajajfinance #Q3marketupdates Q3 FY21 highlights
New loans booked 6.04/7.67 mn Q3fy20
Customer franchise Q3fy21 46.31 vs 40.38 mn 31 Q3fy20 Company acquired 2.19 mn new customers in Q3fy21 vs 2.46
mn Q3 FY20.
AUM 31 Dec 20 143,550 cr vs 145,092 crore as of 31Dec 19.
Liquidity surplus Q321 14,347 cr vs 11 ,384 cr Q320 Cost of liquidity surplus for Q3 FY21 was ~ 213 crore vs ~ 83 crore in
Q3 FY20
NII for Q3 FY21 ~ 4,296 vs ~ 4,535 cr Q3 FY20
NII for
Q3 down 239 cr vs Q3 20, due to higher
reversal of interest income & cost of liquidity
PAT Q3 FY21 1146 vs 1614 crore in Q3 FY20
GNPA ,NNPA as of Q3fy20 0.55% & 0.19% vs
1.61% & 0.70% Q3fy20
PCR Q3fy20 65%
Capital adequacy ratio (including Tier-II capital) Q3fy20 28.18%
Read 4 tweets
20 Jan
@ICICILombard
Q3 & 9 months investor presentation

Leading pvt non life insurer since 2004
12 yr GDPI CAGR 12.3%
Mkt share 9 mns 7.2%
Agents 55615
Increasing share tier 3,4 cities
Virtual offices 840
Solvency Dec 20 - 2.76x ( req1.5x)
#Q3marketupdates
#Q3investorpresentations
In rs billion 9 mfy20 /21
Gross written premium 103.6 / 107.6
GDPI 101.32 /105.25
PAT 9.12 /11.27
ROE 21.8 /22.4%
Solvency ratio 2.18 /2.76x
BV 128.76/159.86
EPS 20.07/24.81

Product mix in %
Motor OD & TP 50/49

Motor GDPI Mix
Pvt car 55.9/57.4
2 wheeler 29.6/27.3
CV 14.5/15.3
Advanced premium Dec 31st 20 - 31.97 bn / Sep 20 - 31.6 bn

Health ,travel & PA GDPI Mix 9 mon fy20/21
Individual 22.5 /24.9%
Group others 40 /23.2%
Group employer-employee 37.4 /51.9

Individual health indemnity grew 25.7% for 9 month from 17 at Sep 20
Read 8 tweets

Did Thread Reader help you today?

Support us! We are indie developers!


This site is made by just two indie developers on a laptop doing marketing, support and development! Read more about the story.

Become a Premium Member ($3/month or $30/year) and get exclusive features!

Become Premium

Too expensive? Make a small donation by buying us coffee ($5) or help with server cost ($10)

Donate via Paypal Become our Patreon

Thank you for your support!

Follow Us on Twitter!