
Here is a little intro thread on how to do simulations of randomized controlled trials.
This thread will take awhile to get all the way through & posted, so please be patient. Maybe wait a few minutes and then come back to it.
This thread will take awhile to get all the way through & posted, so please be patient. Maybe wait a few minutes and then come back to it.
This can be quite useful if you’re trying to understand the operating characteristics (power, type I error probability, potential biases introduced by early stopping rules) of a particular trial design.
I will use R for this thread. It is free. I am not interested in debates about your favorite stats program at this time.
If you want to do it in something else, the *process* can still be educational; you’ll just have to learn to mimic this process in your preferred program.
If you want to do it in something else, the *process* can still be educational; you’ll just have to learn to mimic this process in your preferred program.
I will also not lay claim to being an expert R programmer. Someone may well jump into this thread to tell me there’s a more efficient way to do some of this. Cool, then. This still works.
I will walk through simulating a simple trial design that I have used in prior threads: binary outcome, planning to enroll N=1000 total patients, assigned 1:1 ratio to receive either treatment 1 or treatment 2.
First I will show you the code for simulating a single trial, then I will extend this to show how you can create a large number of simulated trials, which ix useful for studying the operating characteristics.
set.seed(1) # this makes your results reproducible (google “what is a random seed” if you like)
nPatients <- 1000 # specify the number of patients per trial
nPatients <- 1000 # specify the number of patients per trial
death1 <- 0.4 # this is the probability of death assigned for patients receiving treatment 1
death2 <- 0.3 # this is the probability of death assigned for patients receiving treatment 2
death2 <- 0.3 # this is the probability of death assigned for patients receiving treatment 2
pid=seq(1, by=1, len=nPatients) # this simply creates a sequential list of patient ID numbers from 1 to nPatients, which is nonessential for now but may be useful if you want to plan 'interim analyses' at...
.. specific numbers of patients (e.g. create subsets of data and perform interim analysis on just the first 500 patients or whatever) or plot estimates of treatment effect over 'time' since trial start. I always include this from habit.
treatment=rep(1:2, nPatients/2) # this just creates a list of allocations alternating treatment 1 versus treatment 2, repeated by “nPatients/2” which will give a total of “nPatients” assignments.
This allocation sequence should not be used in a real RCT, of course, but for the purpose of these simulations it will work fine. There are no real patients or clinicians created in these simulations, and therefore no one to worry about guessing the next treatment assignment.
If you prefer that your simulations actually use “randomized” allocation, you can do this:
treatment=1+rbinom(nPatients, 1, 0.5) # this randomly assigns each patient to receive treatment 1 or treatment 2 with 50% probability regardless of what came before or after
treatment=1+rbinom(nPatients, 1, 0.5) # this randomly assigns each patient to receive treatment 1 or treatment 2 with 50% probability regardless of what came before or after
The reason I prefer the first of the two is that it maintains even allocation in the number of patients receiving each treatment (of course, with a wee bit more work one can actually create blocked randomization sequence, but I’m trying to keep this thread simple for newbies).
(for those interested in going one step further, the "blockrand" package can be used to generate this, but I'm writing this thread to minimize hurdles for newbies that may not be familiar with R and the concept of "loading packages")
The "simple randomization" example will have slightly lower power due to the allowance for an imbalanced number of patients; the former will have maximum power by ensuring that each trial has even numbers allocated to treatment 1 and treatment 2.
Using "exactly-equal-allocation" means we will be slightly over-estimating the trial power by assuming exactly equal allocation when stratified and/or blocked randomization could allow slightly unequal allocations to occur, e.g. "498 vs 502" patients)
deathprob <- numeric(nPatients)
deathprob[treatment==1]=death1 # this tells it to assign “deathprob” to have the value “death1” specified up above when treatment=1
deathprob[treatment==2]=death2 # same as above but for treatment2 / death2
deathprob[treatment==1]=death1 # this tells it to assign “deathprob” to have the value “death1” specified up above when treatment=1
deathprob[treatment==2]=death2 # same as above but for treatment2 / death2
death=rbinom(nPatients, 1, deathprob) # create vector that assigns death as 0 or 1 based on random binomial draw using "deathprob" assigned above; functionally
table(death, treatment) # do this for a quick check that the number of deaths per group looks *reasonable* given the probabilities you specified.
It won’t match them exactly, but it’s good to do a quick check to see if you reversed them from what you intended or wrote 0.08 instead of 0.8 or something
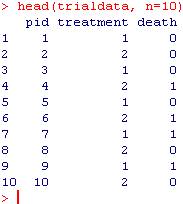
trialdata=data.frame(cbind(pid, treatment, death)) # now we create a data frame called “trialdata” with pid, treatment allocation, and 0/1 death
head(trialdata, n=10) # here you can take a quick look at first 10 rows to see what you’ve wrought. It should look something like this: 
Now we’ll move to analysis and storing the odds ratio, confidence limits, and p-value for the analysis of the full study sample.
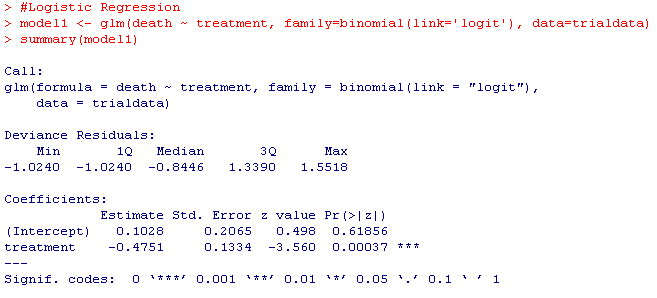
model1 <- glm(death ~ treatment, family=binomial(link='logit'), data=trialdata)
summary(model1)
Your results should look something like this:
model1 <- glm(death ~ treatment, family=binomial(link='logit'), data=trialdata)
summary(model1)
Your results should look something like this:
odds_ratio=exp(summary(model1)$coefficients[2]
odds_ratio
lcl=exp(summary(model1)$coefficients[2]-1.96*summary(model1)$coefficients[4])
lcl
ucl=exp(summary(model1)$coefficients[2]+1.96*summary(model1)$coefficients[4])
ucl
pvalue=summary(model1)$coefficients[8]
pvalue
odds_ratio
lcl=exp(summary(model1)$coefficients[2]-1.96*summary(model1)$coefficients[4])
lcl
ucl=exp(summary(model1)$coefficients[2]+1.96*summary(model1)$coefficients[4])
ucl
pvalue=summary(model1)$coefficients[8]
pvalue

You're still here? Congratulations! OK, so you just wrote a simulation of one RCT with a binary outcome. Now lets write a little loop that will do that a bunch of times.
Start with something like this:
Start with something like this:

Then do something like this:
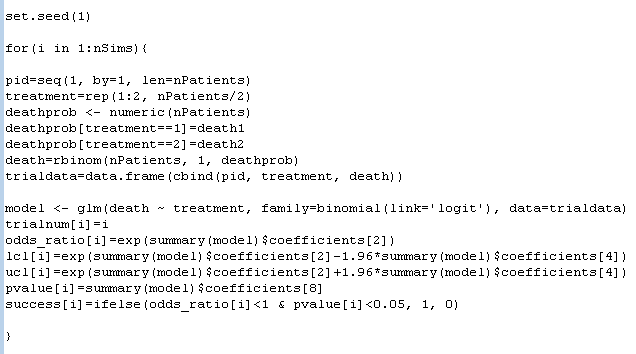
And now you've just simulated 1000 of the above trials, saved the odds ratios, 95% confidence intervals, and p-values from each, plus created a "1" for "success" to mark trials that had p<0.05 and OR favoring treatment 2 vs. treatment 1.
Somewhere, I know, some R jockey is already rolling their eyes. A "for" loop? Really? FFS! Haters gonna hate.
Now let's look at what we have done:

Now we packaged our sim results in a neat little package, and we can use the "head" command to take a look at the first few rows. Cool, right?
The next line below tells us how many of our 1000 trials concluded as a success. 923 of the 1000 concluded as a success. Do you know what this number is?
It's the power! I have found power, that most vexing of statistical concepts, much more intuitive since I started thinking of it this way. Simulate a bunch of trials that mimic the trial design & analysis I would actually do; the % of them that reach positive finding = power.
This has been a 101-level introduction to how one can simulate data to mimic an ECT with specific properties.
I would like to be very clear: this is a 101-level primer only.
I would like to be very clear: this is a 101-level primer only.
Many trial designs involve more complex features than those shown here; if you start tinkering with this in an effort to mimic a ‘real’ trial design you’ve seen, and you get different answers than the manuscript, there may be an additional complexity you are not seeing.
Anyways, now that you know how to do this...once you've mastered this framework, you can do several things that may be useful or interesting.
1. You can estimate a trial’s power to detect a treatment effect under various assumptions (mimic the trial design, data-generating mechanism, and analysis, run a large number of simulations and compute the proportion which would have concluded success)
2. You can estimate a trial design’s type I error probability: just write your code so the null is true (in this case, give the treatment arms the same outcome probability) and see how often the trial concludes success when there is no treatment effect
If you want to test more complex designs (e.g. trials with interim analyses), it’s all about mimicking the trial design and data generating mechanism. Perhaps I'll cover some of these in future threads.
But for now, anyone should be able to download R, and without installing any packages, run the code shown here and simulate some trials.
Have fun out there, kids, and remember: lots of smart people have been thinking hard about this stuff for a very long time, and if you run into something surprising, it may be that you goofed, so ask an expert.
Of course, after posting, I realized that I had made a change between one screenshot and the next that makes the code a little bit inconsistent. I'll correct them, and just copy/paste the code here so you can do the same:
# Trial Design Parameters
nPatients <- 1000
death1 <- 0.4
death2 <- 0.3
# Simulation Parameters
nSims <- 1000
trialnum <- numeric(nSims)
or <-numeric(nSims)
lcl <-numeric(nSims)
ucl <-numeric(nSims)
pvalue <-numeric(nSims)
success <-numeric(nSims)
nPatients <- 1000
death1 <- 0.4
death2 <- 0.3
# Simulation Parameters
nSims <- 1000
trialnum <- numeric(nSims)
or <-numeric(nSims)
lcl <-numeric(nSims)
ucl <-numeric(nSims)
pvalue <-numeric(nSims)
success <-numeric(nSims)
set.seed(1)
for(i in 1:nSims){
pid=seq(1, by=1, len=nPatients)
treatment=rep(1:2, nPatients/2)
deathprob <- numeric(nPatients)
deathprob[treatment==1]=death1
deathprob[treatment==2]=death2
death=rbinom(nPatients, 1, deathprob)
trialdata=data.frame(cbind(pid, treatment, death))
for(i in 1:nSims){
pid=seq(1, by=1, len=nPatients)
treatment=rep(1:2, nPatients/2)
deathprob <- numeric(nPatients)
deathprob[treatment==1]=death1
deathprob[treatment==2]=death2
death=rbinom(nPatients, 1, deathprob)
trialdata=data.frame(cbind(pid, treatment, death))
model <- glm(death ~ treatment, family=binomial(link='logit'), data=trialdata)
trialnum[i]=i
or[i]=exp(summary(model)$coefficients[2])
lcl[i]=exp(summary(model)$coefficients[2]-1.96*summary(model)$coefficients[4])
trialnum[i]=i
or[i]=exp(summary(model)$coefficients[2])
lcl[i]=exp(summary(model)$coefficients[2]-1.96*summary(model)$coefficients[4])
ucl[i]=exp(summary(model)$coefficients[2]+1.96*summary(model)$coefficients[4])
pvalue[i]=summary(model)$coefficients[8]
success[i]=ifelse(or[i]<1 & pvalue[i]<0.05, 1, 0)
}
pvalue[i]=summary(model)$coefficients[8]
success[i]=ifelse(or[i]<1 & pvalue[i]<0.05, 1, 0)
}
simulation_results <- data.frame(cbind(trialnum, or, lcl, ucl, pvalue, success))
head(simulation_results,n=10)
table(success)
head(simulation_results,n=10)
table(success)
• • •
Missing some Tweet in this thread? You can try to
force a refresh


