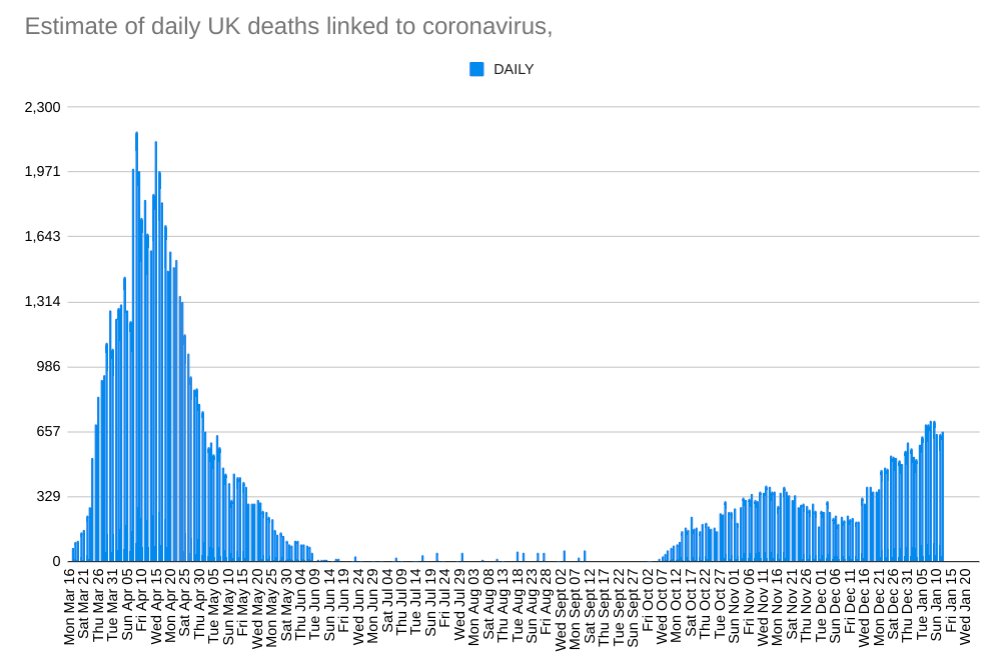
Here is the grim UK death total by different ways of measurement - all above 100,000

28 days since positive test

Death certificates with Covid mentioned

Excess deaths
And how the charts look on a daily basis

Charts courtesy of @jburnmurdoch
Excess was higher in first wave because testing for the virus was so poor.

It's lower in the second wave because there have been fewer non-Covid-19 deaths than usual - likely to be due to social distancing limiting other respiratory illnesses
@GeorgeWParker However you look at it, the UK performance is really bad

• • •

Missing some Tweet in this thread? You can try to force a refresh
 

Keep Current with Chris Giles

Chris Giles Profile picture

Stay in touch and get notified when new unrolls are available from this author!

Read all threads

This Thread may be Removed Anytime!

PDF

Twitter may remove this content at anytime! Save it as PDF for later use!

Try unrolling a thread yourself!

how to unroll video
  1. Follow @ThreadReaderApp to mention us!

  2. From a Twitter thread mention us with a keyword "unroll"
@threadreaderapp unroll

Practice here first or read more on our help page!

More from @ChrisGiles_

19 Jan
UPDATE: Following today's @ONS data for England and Wales, my estimate of the number of UK excess deaths linked to coronavirus since mid March 2020 has surpassed a new grim milestone of

106,300

Of these, 94,745 have been recorded officially, the remainder are estimates

1/
@ONS There is now strong evidence that the number of excess deaths accelerated as the second wave became more intense towards the end of December - estimates of the daily totals rise significantly

But are still well below the spring peak

2/
@ONS It no longer appears true that excess deaths in the second wave are lower than the daily death totals

Why? My hunch is that as waves intensify, hospitals find it harder to save those who would have survived when pressures lighter

3/
Read 9 tweets
18 Jan
Want some good news?

The UK is doing well on vaccinations - domestically on track to hit its targets and internationally ft.com/content/cdfb7b… via @financialtimes
@FinancialTimes In the most recent week, there were nearly 1.8m first jabs given and it's been speeding up (apart from the weekend)
@FinancialTimes This puts the UK fourth in the world at the end of last week with a vaccination rate twice the best placed other European county, Denmark
Read 6 tweets
12 Jan
UPDATE: A grim set of official figures today on deaths means my estimate of the number of people in the UK who have died since mid March linked to coronavirus is

97,700

After a recent acceleration, UK is on course to hit 100,000 by Saturday

1/
Patterns of bank holidays around the end of the year add to uncertainty, but I have been cautious and there has been a recent
inflection point in excess deaths in the data across England, Wales, Scotland and Northern Ireland

Excess deaths rose from mid Dec

2/
Excess deaths had been lower than deaths in hospitals for the whole of the second wave, but in the past two weeks that has no longer been the case.

It suggests fewer people dying of Covid-19 were particularly vulnerable and would have probably died anyway.

3/
Read 6 tweets
11 Jan
There is a remorseless mathematical connection between infections of the over 60s, hospital admisstions, occupied beds, ICU numbers and deaths.

None is looking great - hence the huge concern about the NHS ft.com/content/03e1f5… via @financialtimes
@FinancialTimes Infections of the Over 60s is still rising fast in the latest data. Nothing more than the faintest glimmer of a turning point
@FinancialTimes The same with admissions in England, which have quadrupled since early December
Read 7 tweets
8 Jan
What to make of 1,325 deaths within 28 days of a postive Covid test today

A record on this measure

1) It's bad

2) With 40% not in hospitals, suggests a rising crisis in people's homes and care homes again - that's really bad...

But Image
3) It does need to be put in the context of excess deaths which are running at about 300 a day up to Christmas

4) And since the daily figure was a severe underestimate of the spring peak, this is not a record yet. Excess deaths peaked at about 2,000 a day in April Image
Don't let the more modest excess deaths so far fool anyone into thinking this is mild or like a bad flu year

Since October there have been 19,000 excess deaths in England and Wales. In the last big flu season (2017-18), there were 7,762 in the same period.
Read 6 tweets
6 Jan
Another set of grim Covid data today - daily cases, hospitalisations and deaths up...

That's the big news, but there are a few silver linings in the details of the data

1/ ft.com/content/9f80bc… via @FinancialTimes
@FinancialTimes Some of the worst hit areas for positive cases have stopped getting worse. This is Medway, but the feature applies more generally...

This is Medway, but it applies to v local areas too.

No one should get too excited, the numbers show little sign of decling much

2/ Image
@FinancialTimes There has been somethingof a levelling off in London too in the random testing done by ONS

V early days, but gives hope that the lockdown can work to reduce caseload

3/ Image
Read 6 tweets

Did Thread Reader help you today?

Support us! We are indie developers!


This site is made by just two indie developers on a laptop doing marketing, support and development! Read more about the story.

Become a Premium Member ($3/month or $30/year) and get exclusive features!

Become Premium

Too expensive? Make a small donation by buying us coffee ($5) or help with server cost ($10)

Donate via Paypal Become our Patreon

Thank you for your support!

Follow Us on Twitter!