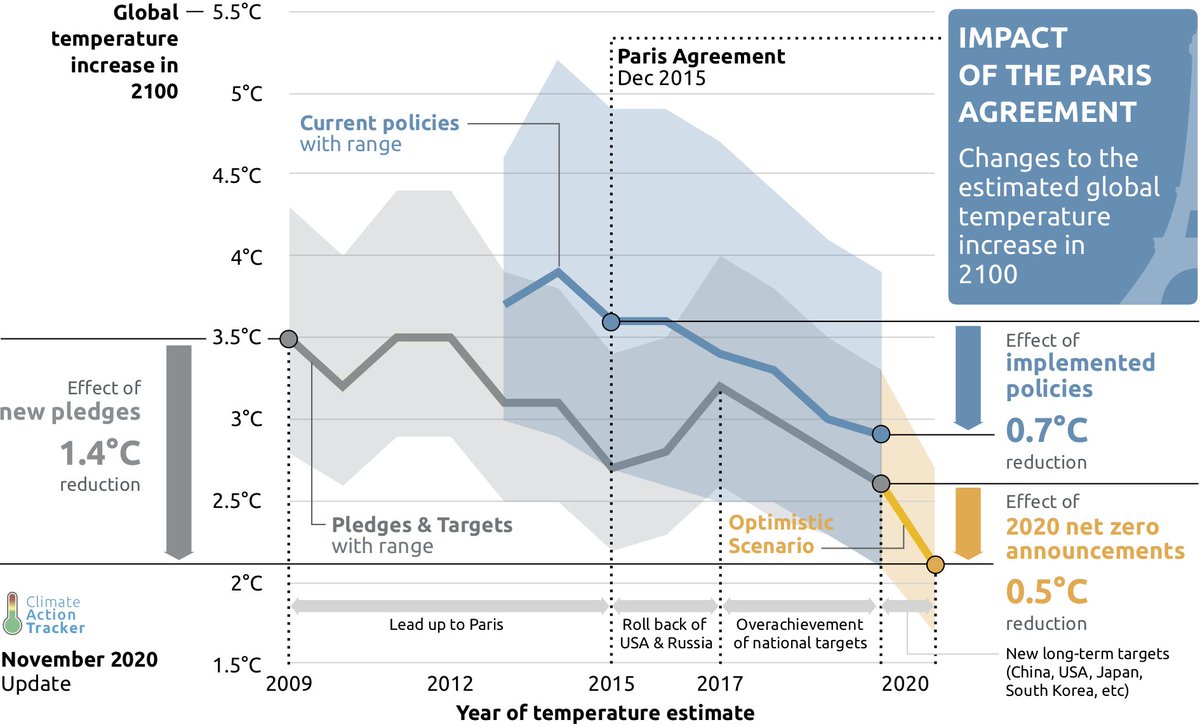
Current commitments by Paris Agreement signatories are far from sufficient to get us to well-below 2C. But @ClimateEnvoy's statement today that Paris alone would lead to "3.7 to 4.5 degrees" C warming appears to be inaccurate. state.gov/special-guest-…
A thread: 1/4
When the Paris Agreement was first passed, a detailed analysis by @JoeriRogelj and colleagues in Nature found a best-estimate (50th percentile) warming of 2.9C (2.2C-3.5C) for unconditional NDCs and 2.7C (2.1C-3.2C) when including conditional NDCs: nature.com/articles/natur… 2/4
Similarly, the folks at @climateactiontr at the time estimated that that Paris commitments would result in around 2.7C (2.2C to 3.4C) if pledges and targets were met. At the time current policies led to ~3.6C warming, but today they only lead to ~2.9C reflecting progress made 3/4
If countries meet stated net-zero commitments, it gets global temperatures down to ~2.1C (1.7C-2.7C), getting within striking distance of Paris goals. We still have a long way to go, but inaccurately minimizing progress to-date is demotivating at a time when we need to speed up.
• • •
Missing some Tweet in this thread? You can try to
force a refresh
A lot of time is wasted in oft-superficial debased about whether renewables or nuclear will be the key to decarbonization.
The reality is that both will play a key role in reaching our ambitious climate goals. Some new results by @VibrantCE show how.
A thread 1/10
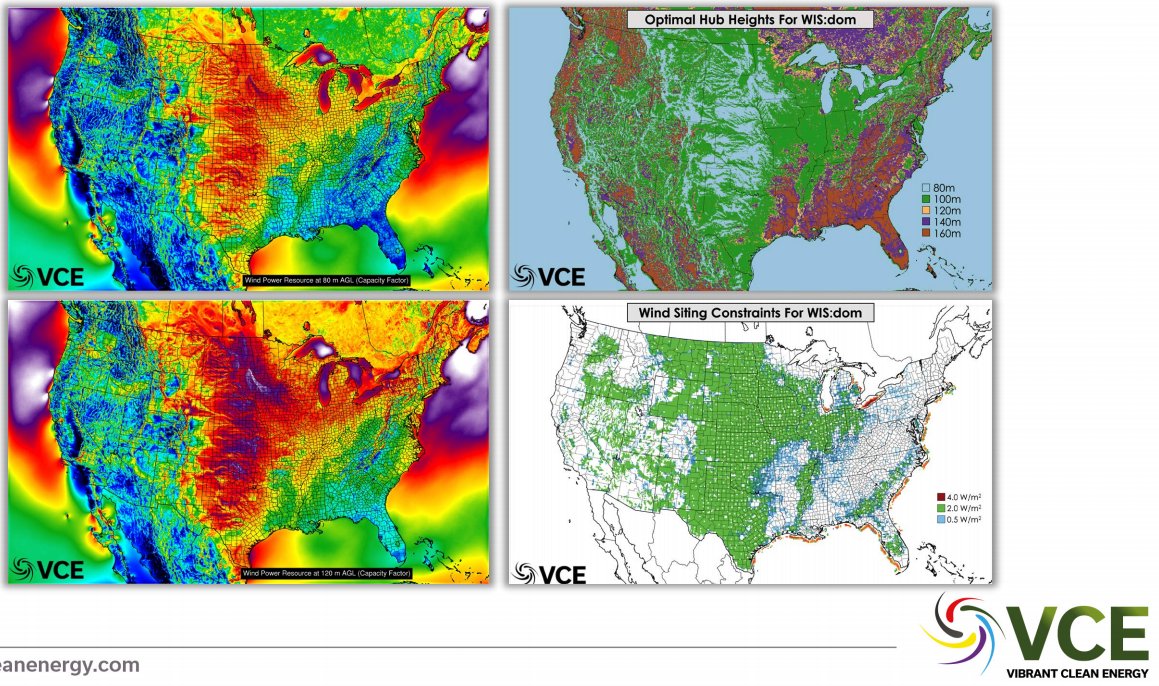
Some of the most cutting edge research on how to integrate clean energy into the grid is done by @DrChrisClack and his team at @VibrantCE. They have done perhaps more than any other group in analyzing the important role that variable renewables can play.
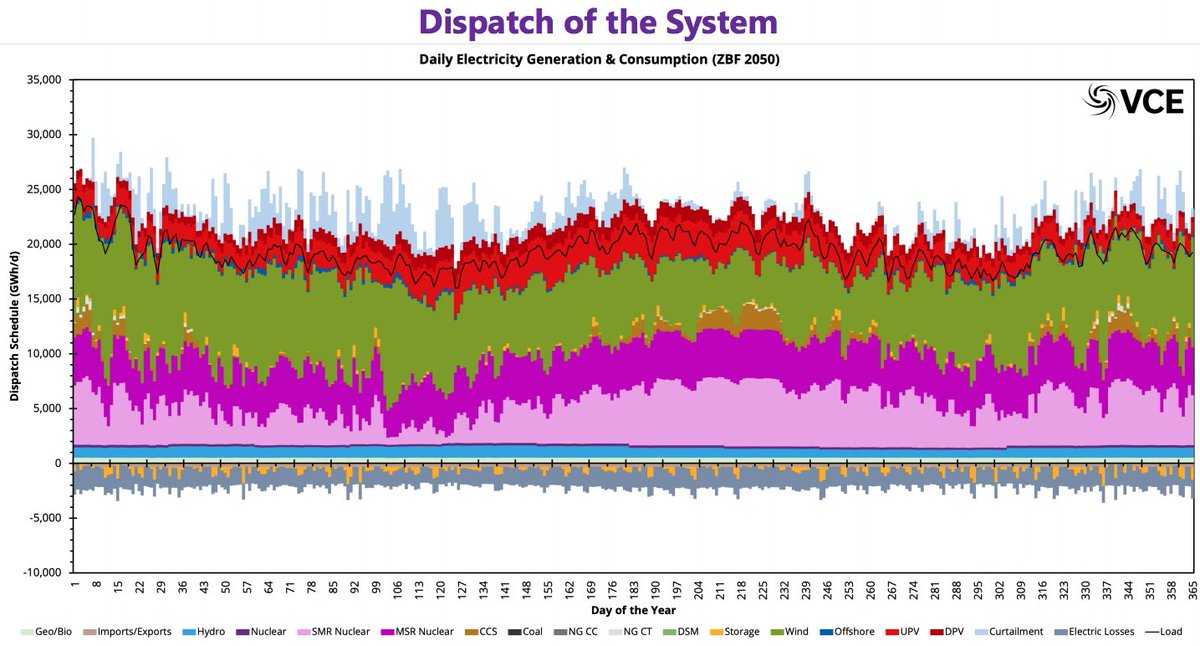
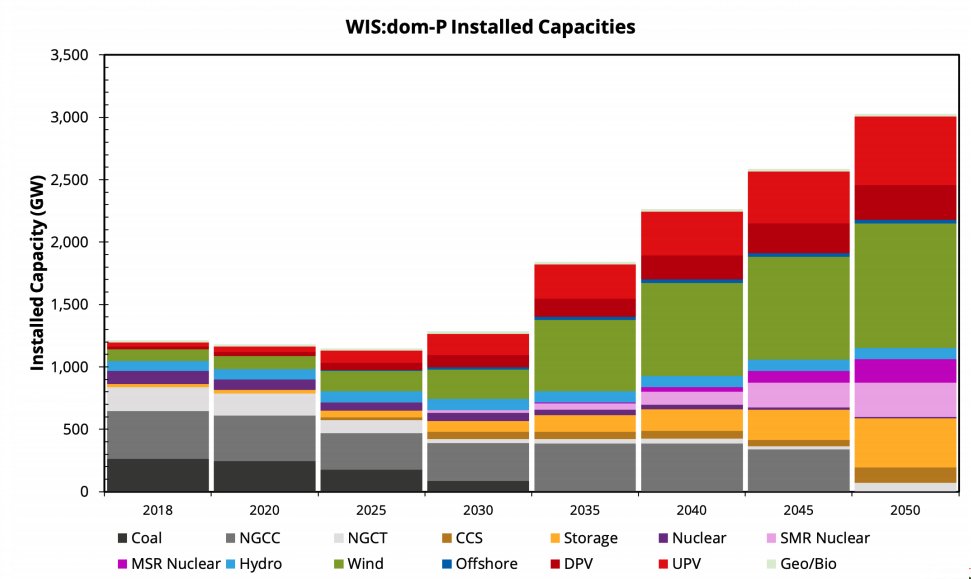
They find – as do most others who build similar models – that wind and solar will be biggest driver of near-term power sector decarbonization. However, they do so using the huge amount of gas capacity we have to fill in the gaps. Heres capacity in their new zero-by-2050 scenario:
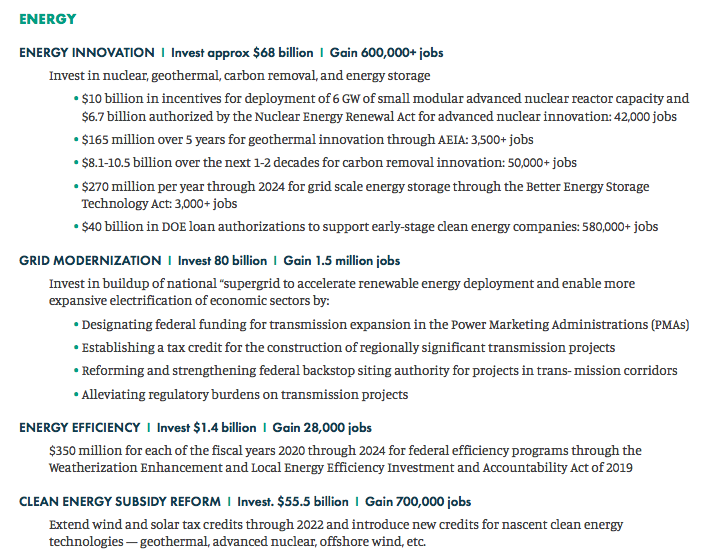
On the energy side some big ones are supercharging DOE loan authorizations to support early-stage clean energy companies, more funding for geothermal/carbon removal/small modular nuclear, grid modernization through a nationwide "supergrid", and extending support for renewables.
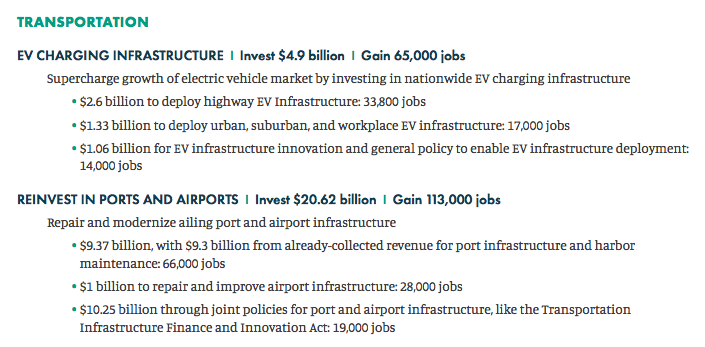
On the transport side, we argue for investing in expanded EV charging infrastructure and investments in ports and airports to reduce emissions, deal with maintenance backlogs and adapt to future climate changes:
There was quite the epic energy twitter thread yesterday involving dozens of different folks. Unfortunately Twitter makes it rather difficult to read the whole thing, so I wanted to highlight one set of discussions for potential follow-up:
Based on a discussion of differences between @JesseJenkins's GenX model and @DrChrisClack's WIS:dom model, I brought up the idea of a CMIP-like process to compare outputs given a common set of inputs/scenarios, similar to whats done in EMF for IAMs today:
Turns out the last 15 years (2006-2020) were twice as far above the long term trend as the hiatus (1998-2012) was below it.
Lets not over-interpret short-term variability, but perhaps its time to start talking about acceleration
It is important to emphasize that some of the discussion of the "hiatus" was driven by observational data artifacts (lack of arctic coverage, biases due to the transition from ships to buoys for ocean measurements) that have now been corrected.
That said, there is growing evidence that the rate of warming has accelerated in recent years.
1970-2020: 0.19C per decade
1998-2012: 0.13C per decade
2006-2020: 0.31C per decade
The next few years will be quite important to watch.
⬆ Surface temps tied w/ 2016 as warmest
⬆ Record high land temps
⬆ Record ocean heat content
⬆ 1st or 2nd highest troposphere temps
⬆ Record high GHGs
⬆ Sea level
⬇ Glaciers
⬇ Sea ice
⬇ Likely 2021 temps
(1)
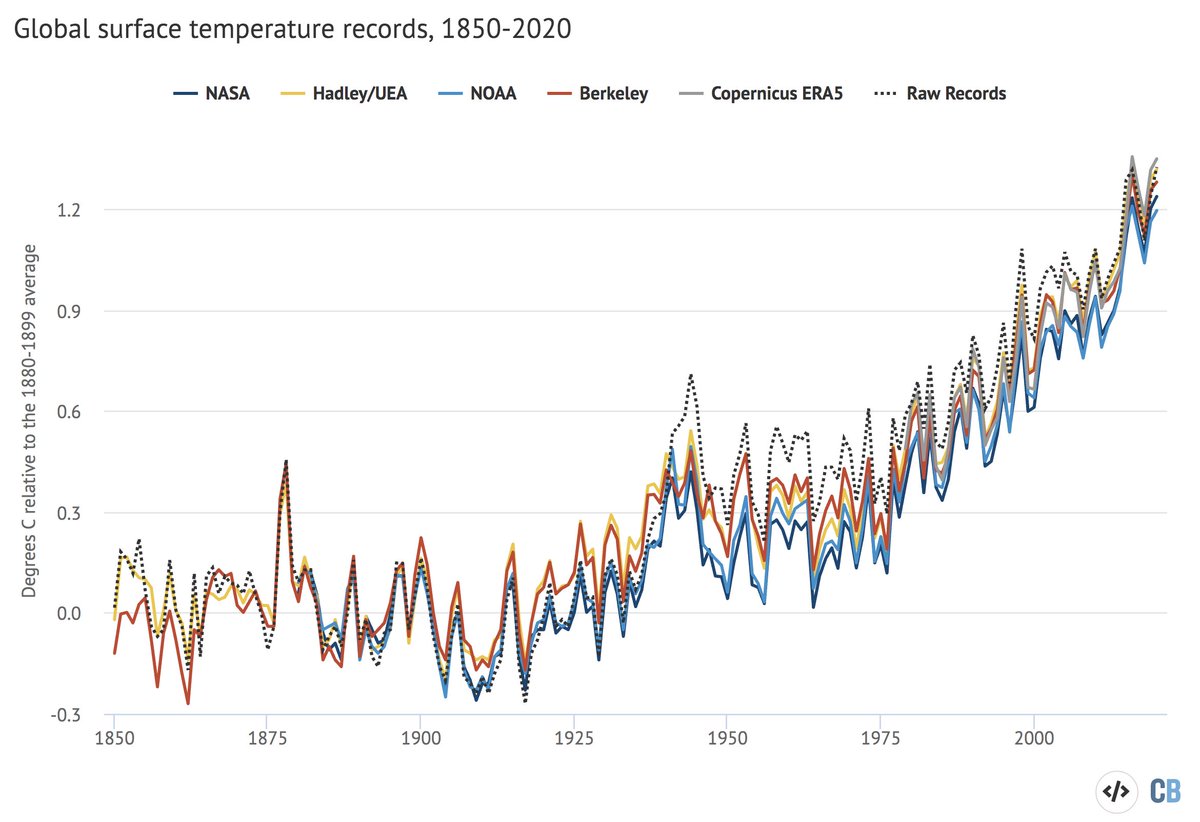
Global surface temps were between 1.2C and 1.3C above preindustrial levels across the various groups for 2020. NASA had it as the warmest, others have it as 2nd warmest, but in all cases the difference with 2016 (< 0.03C) is smaller than the measurement uncertainty (~0.05C): (2)
We also include a raw temp record based on GHCNv4 land data and ICOADS (HadSST3 raw) ocean data (black dashed line). It shows similar warming to preindustrial, and that warming since preindustrial does not depend on adjustments to the data. (3) carbonbrief.org/explainer-how-…
Michael Mann has new book out – The New Climate War. I've coauthored papers in the past with Mike and respect his scientific and communications work. However, in his book he claims that my organization @TheBTI was "initially linked to the fossil fuel industry". This is false. (1)
Prior to the release of his book we reached out and sent the following letter to Mike, giving him the opportunity to correct the record. Unfortunately, as we never heard back we have decided to make it public: thebreakthrough.org/articles/lette… (2)
The @TheBTI has never accepted any money from the fossil fuel industry or industry employees. Mike suggests otherwise based on the fact that BTI once received some funding from the George and Cynthia Mitchell Foundation. thebreakthrough.org/about/who-we-a… (3)