A lot of time is wasted in oft-superficial debased about whether renewables or nuclear will be the key to decarbonization.

The reality is that both will play a key role in reaching our ambitious climate goals. Some new results by @VibrantCE show how.

A thread 1/10
Some of the most cutting edge research on how to integrate clean energy into the grid is done by @DrChrisClack and his team at @VibrantCE. They have done perhaps more than any other group in analyzing the important role that variable renewables can play.
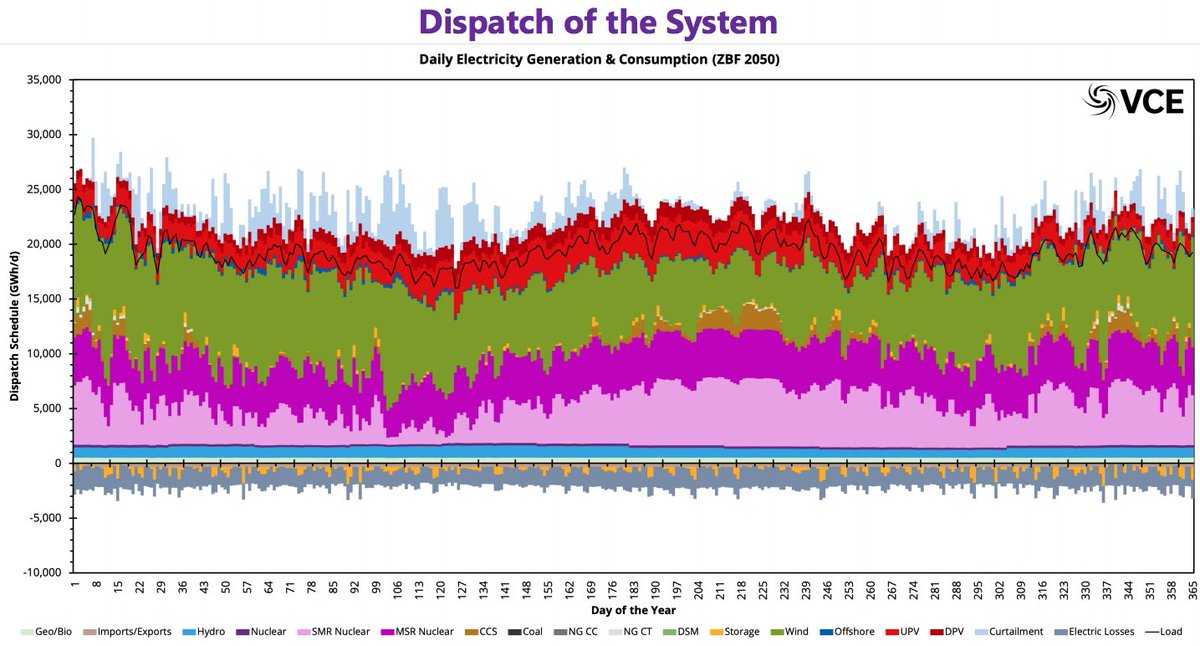
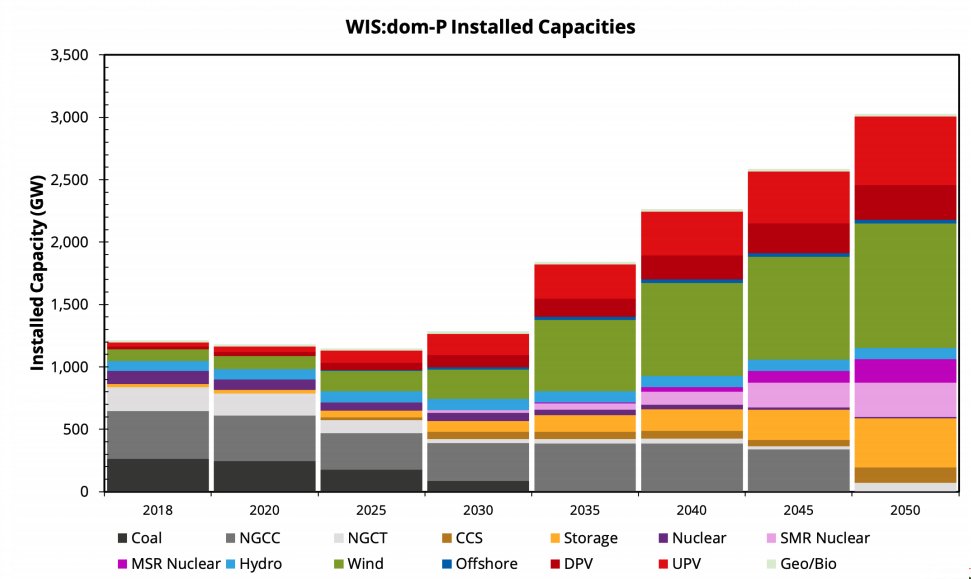
They find – as do most others who build similar models – that wind and solar will be biggest driver of near-term power sector decarbonization. However, they do so using the huge amount of gas capacity we have to fill in the gaps. Heres capacity in their new zero-by-2050 scenario:
In the longer run three factors are needed to move away from natural gas in the power sector: grid-scale storage, improved transmission, and clean firm generation like nuclear.
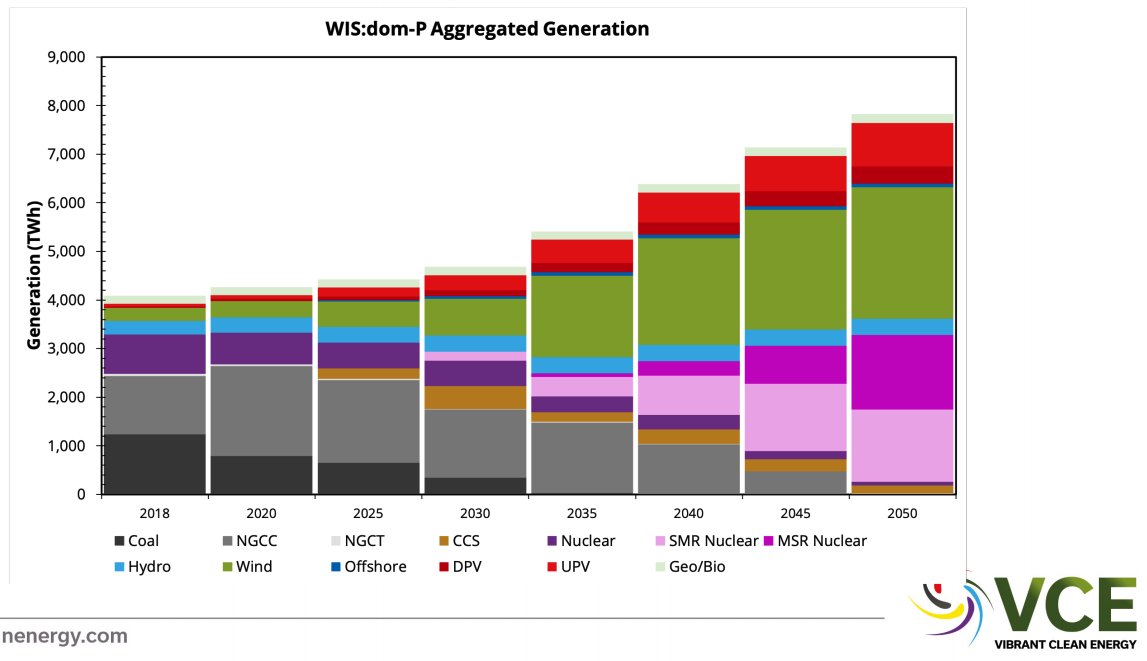
In their main scenario, they have a very large increase in advanced nuclear generation – on the form of molten salt reactors and small and modular reactors – after 2030. By 2040 they produce more electricity than solar, and by 2050 more than wind:
Of course, any projection of the optimal energy system 30 years from now will be subject to huge uncertainties and highly sensitive to assumptions about future energy costs. It may well turn out that advanced nuclear has more challenges than foreseen.
But the main takeaway is this: nuclear is a compliment to rather than a supplement for renewables. We cannot easily or cheaply power the entire US with just wind, water, and solar, and need more RD&D investments in clean firm generation at the same time we accelerate renewables.
We won't be at 100% renewables, and we won't be at 100% nuclear. Lets stop wasting time debating which is the non-existent silver bullet to climate change and move forward toward decarbonizing the power sector as fast as possible.
Initial results from the @VibrantCE Zero By Fifty scenario can be found here: vibrantcleanenergy.com/wp-content/upl…

They should be releasing a more detailed report later this year.
*Debates, that is. One of these years I will learn to proofread...

• • •

Missing some Tweet in this thread? You can try to force a refresh
 

Keep Current with Zeke Hausfather

Zeke Hausfather Profile picture

Stay in touch and get notified when new unrolls are available from this author!

Read all threads

This Thread may be Removed Anytime!

PDF

Twitter may remove this content at anytime! Save it as PDF for later use!

Try unrolling a thread yourself!

how to unroll video
  1. Follow @ThreadReaderApp to mention us!

  2. From a Twitter thread mention us with a keyword "unroll"
@threadreaderapp unroll

Practice here first or read more on our help page!

More from @hausfath

29 Jan
Meeting Paris Agreement climate targets will involve building a lot of big clean energy projects extremely quickly. We need to streamline permitting, remove barriers, and take the power away from NIMBYies to gum up the works if we want any hope of a rapid energy transition Image
We are talking about some large-scale land use changes happening in a 30-year timeframe; here is what the region around St. Louis might look like in 2050, for example: Image
Similarly, we will require a huge amount of new transmission to help balance out generation and demand in a high renewable future: Image
Read 5 tweets
28 Jan
Theres lots to be excited about with the new Biden climate EOs. But at the same time meaningful, durable climate policy will also require legislation.

In a new @TheBTI report we take a deep dive into policies that are both impactful and could become law: s3.us-east-2.amazonaws.com/uploads.thebre…
On the energy side some big ones are supercharging DOE loan authorizations to support early-stage clean energy companies, more funding for geothermal/carbon removal/small modular nuclear, grid modernization through a nationwide "supergrid", and extending support for renewables.
On the transport side, we argue for investing in expanded EV charging infrastructure and investments in ports and airports to reduce emissions, deal with maintenance backlogs and adapt to future climate changes:
Read 6 tweets
28 Jan
There was quite the epic energy twitter thread yesterday involving dozens of different folks. Unfortunately Twitter makes it rather difficult to read the whole thing, so I wanted to highlight one set of discussions for potential follow-up:
Based on a discussion of differences between @JesseJenkins's GenX model and @DrChrisClack's WIS:dom model, I brought up the idea of a CMIP-like process to compare outputs given a common set of inputs/scenarios, similar to whats done in EMF for IAMs today:
Jesse suggested that he is working with EDM to fundraise for something like this:
Read 9 tweets
27 Jan
Current commitments by Paris Agreement signatories are far from sufficient to get us to well-below 2C. But @ClimateEnvoy's statement today that Paris alone would lead to "3.7 to 4.5 degrees" C warming appears to be inaccurate. state.gov/special-guest-…

A thread: 1/4
When the Paris Agreement was first passed, a detailed analysis by @JoeriRogelj and colleagues in Nature found a best-estimate (50th percentile) warming of 2.9C (2.2C-3.5C) for unconditional NDCs and 2.7C (2.1C-3.2C) when including conditional NDCs: nature.com/articles/natur… 2/4
Similarly, the folks at @climateactiontr at the time estimated that that Paris commitments would result in around 2.7C (2.2C to 3.4C) if pledges and targets were met. At the time current policies led to ~3.6C warming, but today they only lead to ~2.9C reflecting progress made 3/4
Read 4 tweets
14 Jan
Remember the 15-year "hiatus" in global warming?

Turns out the last 15 years (2006-2020) were twice as far above the long term trend as the hiatus (1998-2012) was below it.

Lets not over-interpret short-term variability, but perhaps its time to start talking about acceleration Image
It is important to emphasize that some of the discussion of the "hiatus" was driven by observational data artifacts (lack of arctic coverage, biases due to the transition from ships to buoys for ocean measurements) that have now been corrected.
That said, there is growing evidence that the rate of warming has accelerated in recent years.

1970-2020: 0.19C per decade
1998-2012: 0.13C per decade
2006-2020: 0.31C per decade

The next few years will be quite important to watch.
Read 4 tweets
14 Jan
Our State of the Climate 2020 is live! carbonbrief.org/state-of-the-c…

⬆ Surface temps tied w/ 2016 as warmest
⬆ Record high land temps
⬆ Record ocean heat content
⬆ 1st or 2nd highest troposphere temps
⬆ Record high GHGs
⬆ Sea level
⬇ Glaciers
⬇ Sea ice
⬇ Likely 2021 temps
(1)
Global surface temps were between 1.2C and 1.3C above preindustrial levels across the various groups for 2020. NASA had it as the warmest, others have it as 2nd warmest, but in all cases the difference with 2016 (< 0.03C) is smaller than the measurement uncertainty (~0.05C): (2)
We also include a raw temp record based on GHCNv4 land data and ICOADS (HadSST3 raw) ocean data (black dashed line). It shows similar warming to preindustrial, and that warming since preindustrial does not depend on adjustments to the data. (3) carbonbrief.org/explainer-how-…
Read 22 tweets

Did Thread Reader help you today?

Support us! We are indie developers!


This site is made by just two indie developers on a laptop doing marketing, support and development! Read more about the story.

Become a Premium Member ($3/month or $30/year) and get exclusive features!

Become Premium

Too expensive? Make a small donation by buying us coffee ($5) or help with server cost ($10)

Donate via Paypal Become our Patreon

Thank you for your support!

Follow Us on Twitter!