Remember the 15-year "hiatus" in global warming?

Turns out the last 15 years (2006-2020) were twice as far above the long term trend as the hiatus (1998-2012) was below it.

Lets not over-interpret short-term variability, but perhaps its time to start talking about acceleration Image
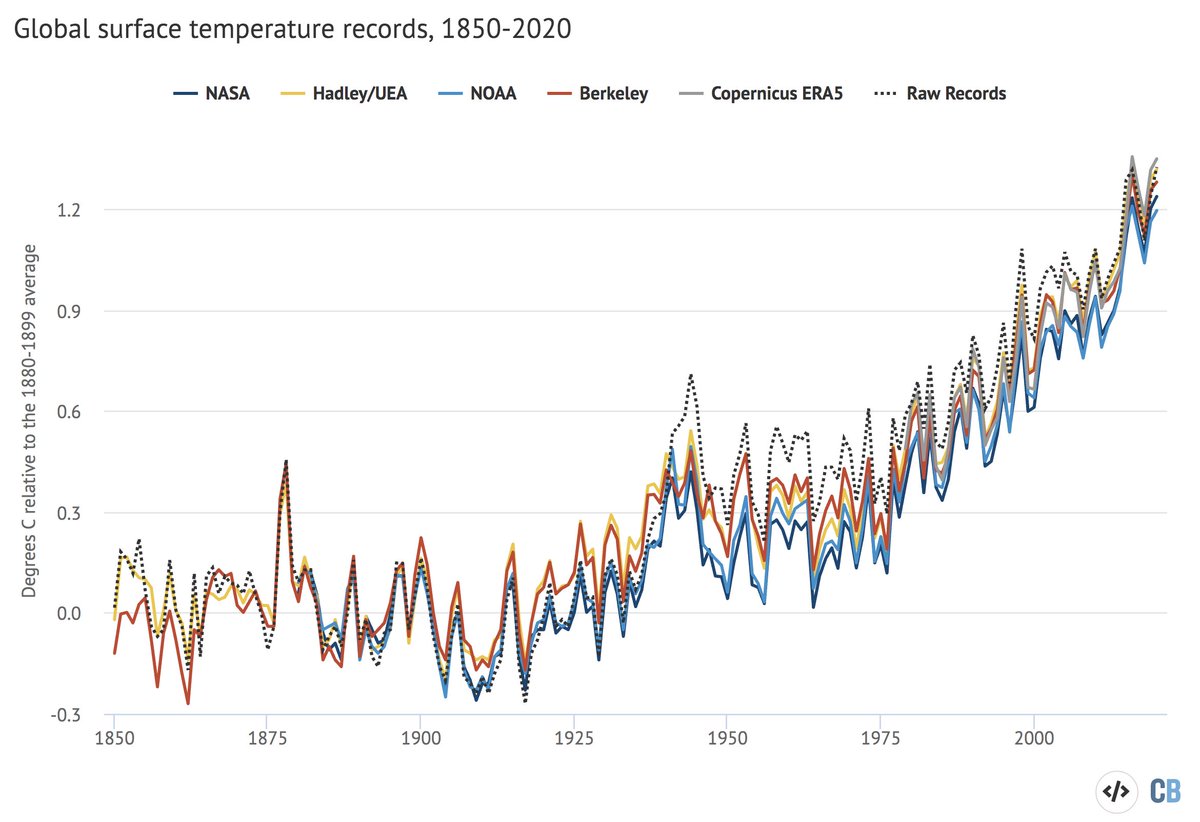
It is important to emphasize that some of the discussion of the "hiatus" was driven by observational data artifacts (lack of arctic coverage, biases due to the transition from ships to buoys for ocean measurements) that have now been corrected.
That said, there is growing evidence that the rate of warming has accelerated in recent years.

1970-2020: 0.19C per decade
1998-2012: 0.13C per decade
2006-2020: 0.31C per decade

The next few years will be quite important to watch.
(Note that if we try the other commonly used hiatus period – 2000-2014 – the trend is slightly higher at 0.14C pre decade)

• • •

Missing some Tweet in this thread? You can try to force a refresh
 

Keep Current with Zeke Hausfather

Zeke Hausfather Profile picture

Stay in touch and get notified when new unrolls are available from this author!

Read all threads

This Thread may be Removed Anytime!

PDF

Twitter may remove this content at anytime! Save it as PDF for later use!

Try unrolling a thread yourself!

how to unroll video
  1. Follow @ThreadReaderApp to mention us!

  2. From a Twitter thread mention us with a keyword "unroll"
@threadreaderapp unroll

Practice here first or read more on our help page!

More from @hausfath

14 Jan
Our State of the Climate 2020 is live! carbonbrief.org/state-of-the-c…

⬆ Surface temps tied w/ 2016 as warmest
⬆ Record high land temps
⬆ Record ocean heat content
⬆ 1st or 2nd highest troposphere temps
⬆ Record high GHGs
⬆ Sea level
⬇ Glaciers
⬇ Sea ice
⬇ Likely 2021 temps
(1)
Global surface temps were between 1.2C and 1.3C above preindustrial levels across the various groups for 2020. NASA had it as the warmest, others have it as 2nd warmest, but in all cases the difference with 2016 (< 0.03C) is smaller than the measurement uncertainty (~0.05C): (2)
We also include a raw temp record based on GHCNv4 land data and ICOADS (HadSST3 raw) ocean data (black dashed line). It shows similar warming to preindustrial, and that warming since preindustrial does not depend on adjustments to the data. (3) carbonbrief.org/explainer-how-…
Read 22 tweets
12 Jan
Michael Mann has new book out – The New Climate War. I've coauthored papers in the past with Mike and respect his scientific and communications work. However, in his book he claims that my organization @TheBTI was "initially linked to the fossil fuel industry". This is false. (1)
Prior to the release of his book we reached out and sent the following letter to Mike, giving him the opportunity to correct the record. Unfortunately, as we never heard back we have decided to make it public: thebreakthrough.org/articles/lette… (2)
The @TheBTI has never accepted any money from the fossil fuel industry or industry employees. Mike suggests otherwise based on the fact that BTI once received some funding from the George and Cynthia Mitchell Foundation. thebreakthrough.org/about/who-we-a… (3)
Read 12 tweets
11 Jan
One of the under-appreciated aspects of the Chinese 2060 net-zero target is the massive spillover effects it would have on the rest of the world. An economy as large as China's mobilizing to decarbonize the entire economy would substantially drive down clean energy costs. 1/6
The recent IEA WEO 2020 predicts that global CO2 emissions will plateau around 2019 levels, but does not include recent net-zero targets. Including China's (via the Tsinghua University analysis) would lead to global emissions declining in coming years: 2/6
If China were to decarbonize while the rest of the world did nothing, it alone would drive global solar prices down by 65% and wind prices down by 17% assuming historical learning rates continue. These effects will be even more pronounced for nascent tech outside power sector 3/6
Read 6 tweets
7 Jan
If we can get emissions down to zero (or net-zero), the planet will likely stop warming. Good @guardian piece covering this issue – which is well understood by the scientific community but often missed in public discussions. theguardian.com/environment/20… 1/6
This is good news, because it means that warming that occurs this century is almost entirely under our control. We can decided how much CO2 and other greenhouse gases we emit, and the climate will respond accordingly. 2/6
However, the downside of this finding is that even if we get emissions all the way down to zero, temperatures will not fall, at least for the next few centuries. Without net-negative emissions climate change is largely irreversible. 3/6
Read 6 tweets
5 Jan
Lets clarify something about "committed warming". A world where concentrations of CO2 and other GHGs remain constant in the atmosphere is not the same as a world where emissions go to zero. The former has ~0.5C or more warming "in the pipeline", while the latter is closer to 0C.
If concentrations stay constant (e.g. atmospheric CO2 remains at 412 ppm indefinitely), the oceans continue to heat up for the next few millennia. The vast heat capacity of the deep oceans currently buffers warming, as some of the heat diffuses down to the deep ocean.
If emissions actually fall all the way to zero (or net-zero), atmospheric CO2 concentrations start declining. This mostly counteracts the warming in the pipeline as the oceans continue to warm to reach equilibrium. agupubs.onlinelibrary.wiley.com/doi/full/10.10… Image
Read 7 tweets
4 Jan
Fascinating new paper by @AndrewDessler and colleagues arguing committed warming might be higher than expected given historical pattern effects. Its combining a lot of different concepts together, so lets spend some time disentangling them nature.com/articles/s4155…

A thread: 1/19
The paper's headline number is that we previously thought the world was committed to 1.3C warming, but that number is actually over 2C (> 1.5C by 2100). This is quite a different message than we get from Earth System Models, which suggest committed warming is only ~1.2C. 2/19
This would imply that the 1.5C by 2100 target is effectively impossible, and that long-term warming of >2C would be very difficult to avoid. However, the devil is in the details, and the picture is not quite as dire as it would seem at first glance. 3/19
Read 19 tweets

Did Thread Reader help you today?

Support us! We are indie developers!


This site is made by just two indie developers on a laptop doing marketing, support and development! Read more about the story.

Become a Premium Member ($3/month or $30/year) and get exclusive features!

Become Premium

Too expensive? Make a small donation by buying us coffee ($5) or help with server cost ($10)

Donate via Paypal Become our Patreon

Thank you for your support!

Follow Us on Twitter!