Earth is a big, weird place in space. There’s so much happening on this planet all at once that it’s easy to forget some minor details. We asked our friends here at @NASA — and we want to share with you — the facts about Earth that live rent free in our heads. Photo of the limb of Earth taken from a window in space
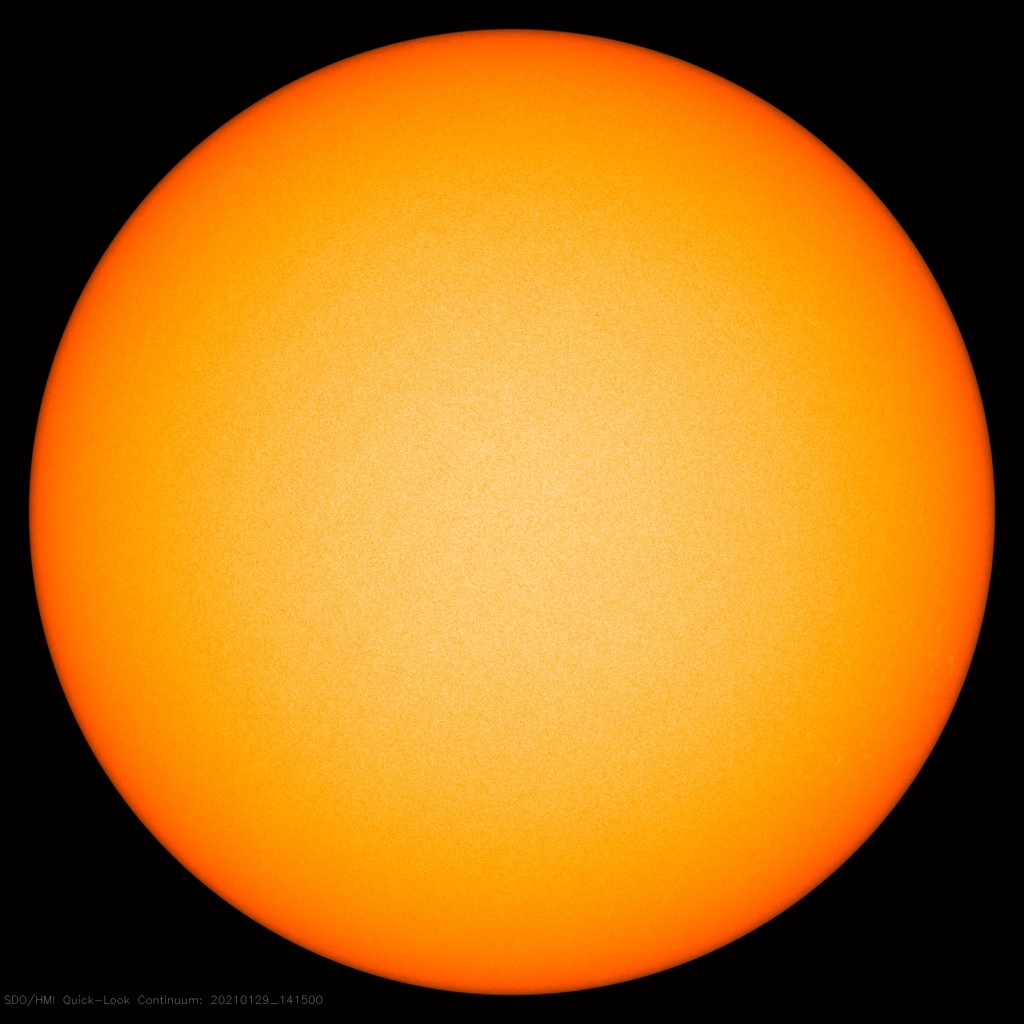
Earth has a solid inner core that is almost as hot as the surface of the Sun. Earth’s core gets as hot as 9,800 degrees Fahrenheit, while the surface of the Sun is about 10,000 degrees Fahrenheit. Right, @NASASun?
solarsystem.nasa.gov/planets/earth/…
solarsystem.nasa.gov/solar-system/s… Image of the sunlit side of Earth from the Earth PolychromatImage of the Sun from the Solar Dynamics Observatory
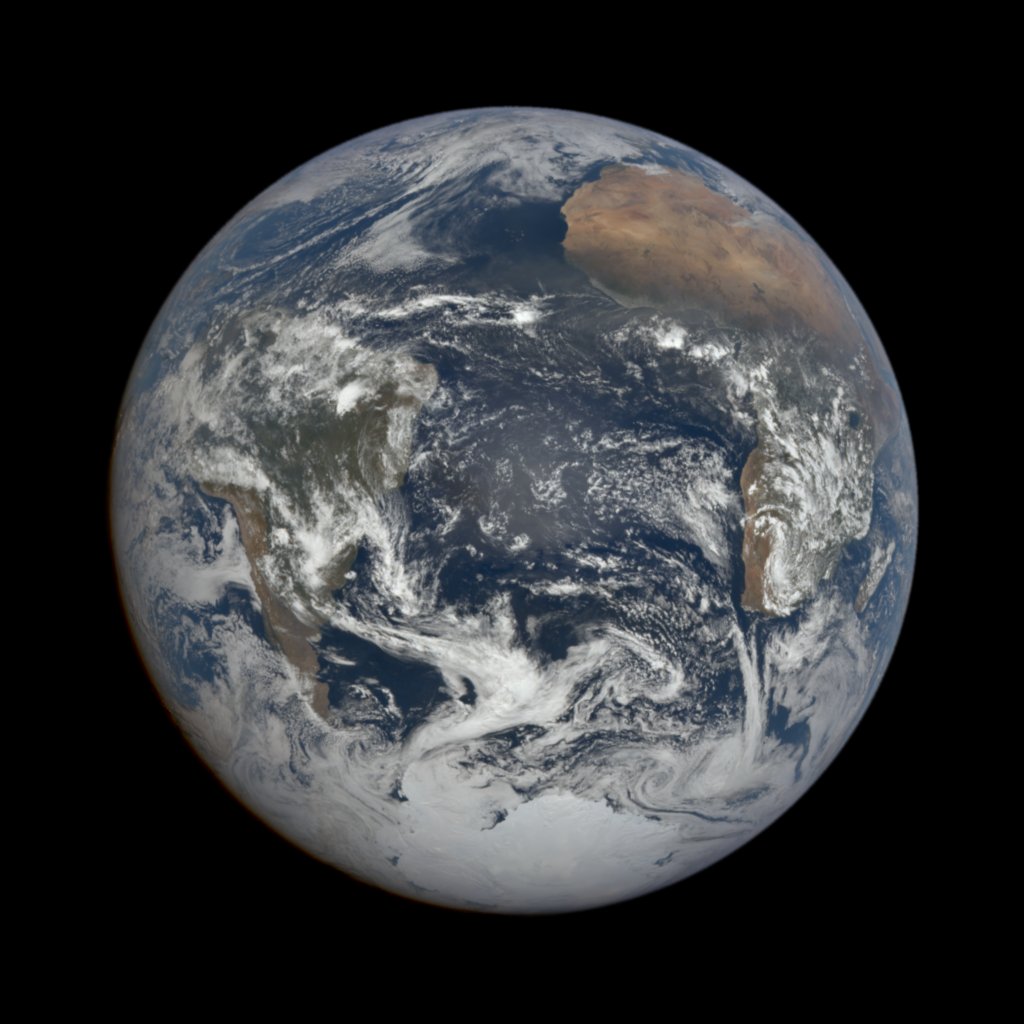
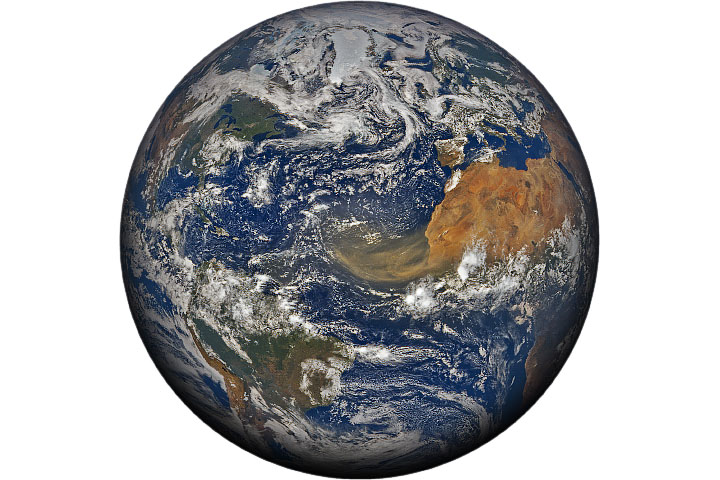
Dust from the Sahara fertilizes the Amazon rainforest. 27.7 million tons blow all the way across the Atlantic Ocean to the rainforest each year, where it brings phosphorus -- a nutrient plants need to grow.
go.nasa.gov/3aiOtWP Satellite image of the sunlit side of Earth with dust visibl
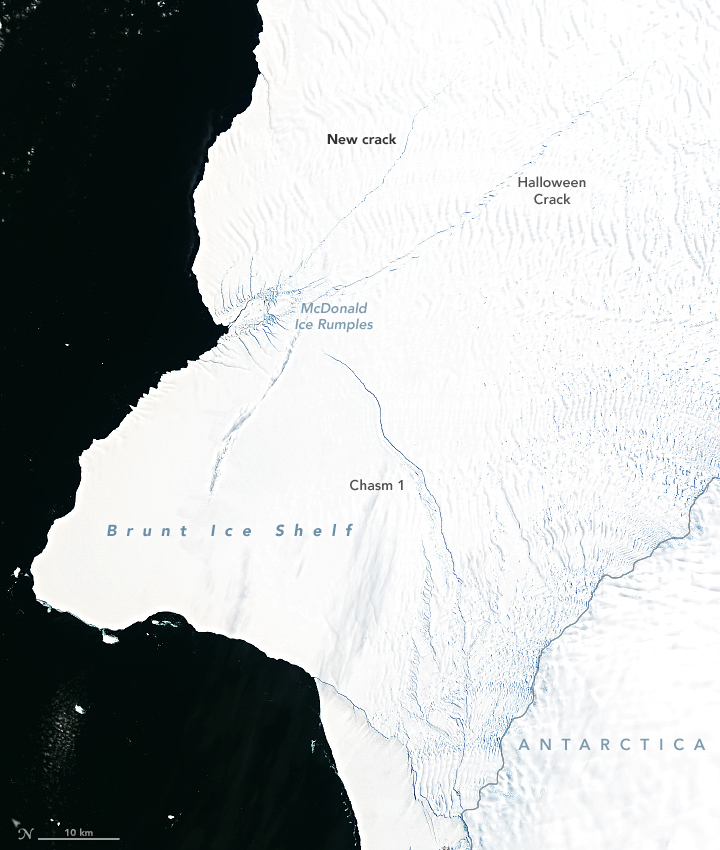
Ice in Antarctica looks solid and still, but it’s actually flowing -- in some places it flows so fast that scientific instruments can move as much as a kilometer (more than half a mile!) a year.
go.nasa.gov/3pvcO1Z
Speaking of Antarctica: Ice shelves (the floating part of ice sheets) can be as big as Texas. Because they float, they rise and fall with the tide. Floating ice as big as Texas, attached to the Antarctic Ice Sheet, can rise and fall up to ~26 feet!
go.nasa.gov/3pvB045 Satellite image of the Brunt Ice Shelf in Antarctica
Melting ice on land makes its way to the ocean. As polar glaciers melt, the water sloshes to the equator and which can actually slow the spin of the Earth.
go.nasa.gov/2M7xkaF
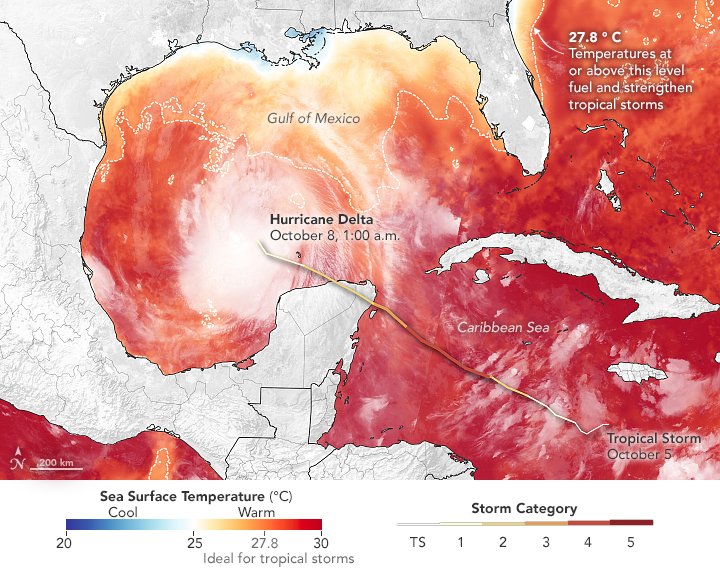
Even though it looks flat, the ocean isn’t level. The surface has peaks and valleys and varies due to changes in height of the land below, winds, temperature, saltiness, atmospheric pressure, ocean circulation, and more.
go.nasa.gov/3tabd3Z

• • •

Missing some Tweet in this thread? You can try to force a refresh
 

Keep Current with NASA Earth

NASA Earth Profile picture

Stay in touch and get notified when new unrolls are available from this author!

Read all threads

This Thread may be Removed Anytime!

PDF

Twitter may remove this content at anytime! Save it as PDF for later use!

Try unrolling a thread yourself!

how to unroll video
  1. Follow @ThreadReaderApp to mention us!

  2. From a Twitter thread mention us with a keyword "unroll"
@threadreaderapp unroll

Practice here first or read more on our help page!

More from @NASAEarth

27 Jan
2020 was tied with 2016 for the warmest year on record, part of a long-term warming trend driven by human activity. @NASA works to monitor how our climate is changing — melting ice, warming temperatures, longer fire seasons, and more.
go.nasa.gov/2XDI6rh
Recent NASA research has shown how the warming ocean is melting glaciers in Greenland.
go.nasa.gov/3c4pdWO
Combined, Greenland and Antarctica are losing 318 gigatons of ice per year. As the ice melts into the ocean, sea levels rise globally.
go.nasa.gov/3cb0bCC
Over the last 35 years, fire seasons have been burning longer. In the United States, changes to the timing of snowmelt and precipitation — linked to climate change — contributed to the longer fire seasons.
go.nasa.gov/3pmxY2h
Read 4 tweets
14 Jan
Globally, 2020 was the hottest year on record, effectively tying 2016, the previous record. Overall, Earth’s average temperature has risen more than 2 degrees F since the 1880s. The effects of rising temperatures are felt around the world.
go.nasa.gov/3iakW5c
2020 was a year of extremes, with record-breaking hurricane and fire seasons. Higher surface temperatures and more heat in the climate system can fuel different extreme events, directly and indirectly, like increasing tropical storm intensity.
This year, we saw record-setting fires in Australia and the western U.S., after years of high temperature and drought set the stage. Smoke from fires in both regions reached so high into the atmosphere that it formed clouds.
go.nasa.gov/396zPBt
go.nasa.gov/33oxoqO Labeled satellite image of smoke from fires in CaliforniaLabeled satellite image of smoke from fires in Australia
Read 8 tweets
10 Nov 20
We know that as human activity warms the planet, global sea level is rising. We know that about 2/3 of sea level rise so far has come from melting ice. But how do we know this? We can measure it from space.
#SeeingTheSeas Visualization of sea level rise mapped around the planet on
Sea level isn’t uniform around the planet. Tides and currents, the density and temperature of water, and landforms can affect where the ocean piles up. We know this because we measure the shape of the ocean using radar altimetry.
go.nasa.gov/3n0EpGB Graph of sea level rise measurements from the tide gauge rec
Altimetry works by bouncing radio waves off the ocean surface and timing how quickly they return. Then comes the next challenge: Calculating the natural and seasonal changes in ocean height to determine how much more global warming has made seas rise.
Read 8 tweets
9 Nov 20
The effects of sea level rise come in many forms. During tropical storms, higher sea levels drive intense storm surges — water level much higher than normal tides. But with sea level rise, the tides themselves can cause flooding.

#SeeingTheSeas
During high-tide floods, water can make its way from the ocean onto land and bubble up from storm drains. In cities like Miami & Annapolis, high-tide flooding can close down streets & businesses, and damage infrastructure like pipes & wastewater systems.
go.nasa.gov/3eISZj9
Between 2000-2015, days with high-tide flooding doubled along the U.S. Northeast Atlantic coast, & that will likely keep climbing. Some locations could see high-tide flooding 180 days a year by 2050. From May '19 to April '20, Annapolis had a record 18 days of high-tide flooding.
Read 4 tweets
8 Nov 20
Sea levels on the West Coast of the United States are rising at a faster rate than the global average – and that trend is likely to continue for at least a few years, with likely effects for people living in the region.
#SeeingTheSeas
go.nasa.gov/3n2Kxy7
The height of the sea surface in the western and eastern tropical Pacific Ocean seesaws over time – when one is higher, the other is lower. This is driven on shorter timescales by two natural climate patterns: the El Niño-Southern Oscillation and the Pacific Decadal Oscillation.
Every few years, the El Niño Southern Oscillation (ENSO) pattern produces either an El Niño or a La Niña event. El Niños can increase West Coast sea level; while La Niñas can decrease it.
Read 6 tweets
13 Oct 20
#HurricaneDelta was the 25th named Atlantic storm of the 2020 hurricane season. After exhausting a list of prepared names, @WMO turns to the Greek alphabet to name storms.
Hurricanes typically get a massive boost of energy when they pass over warm waters. #HurricaneDelta rapidly intensified to a Category 4 storm. #HurricaneLaura also underwent rapid intensification in the Gulf of Mexico.
go.nasa.gov/2GTxb7V Natural color satellite image of Hurricane Delta making landImage of Hurricane Delta making landfall with ocean colored
As it made landfall, #HurricaneDelta was generating heavy rainfall. Combining data from @NASARain’s satellites with computer models helps track precipitation to help those living in the storm’s path.
go.nasa.gov/3dlIXnr
Read 4 tweets

Did Thread Reader help you today?

Support us! We are indie developers!


This site is made by just two indie developers on a laptop doing marketing, support and development! Read more about the story.

Become a Premium Member ($3/month or $30/year) and get exclusive features!

Become Premium

Too expensive? Make a small donation by buying us coffee ($5) or help with server cost ($10)

Donate via Paypal Become our Patreon

Thank you for your support!

Follow Us on Twitter!