NASA Earth Profile picture
NASA’s favorite (habitable) planet. 🌎💚 Studying Earth from ground to orbit. Verification: https://t.co/86cw0iJQEy
Aug 14, 2023 5 tweets 2 min read
NASA confirms: this July was the hottest month on record.🌡️

Our record starts in 1880, when consistent global recordkeeping became possible. It shows an undeniable pattern of increasing global temperatures, primarily from human emissions of carbon dioxide. https://t.co/YqTfn9BMuXgo.nasa.gov/3qwsszU
Line graph of July temperatures in NASA’s temperature record. The bottom axis starts in 1880 (left) and goes to 2023 (right). On the X axis are temperature anomalies in degrees Celsius, from negative 0.5 to 1.0. A red line starts at zero and zig-zags up and down from year to year, but the overall trend steadily increases. By the end of the visualization, the red line spikes up over a 1.1 degree Celsius anomaly for July of 2023. “This July was massively warmer than any previous July and any previous month on record, which goes back to 1880,” said @NASAGISS Director Gavin Schmidt.
Jan 12, 2023 7 tweets 5 min read
2022 was effectively tied for the 5th warmest year on record, according to @NASA analysis. 🌏🌡

@NOAA’s record indicates 2022 is the 6th warmest. The past 9 years are the warmest years since at least 1880. go.nasa.gov/3VZBM9a Earth in 2022 was about 1.9F (or about 1.1C) warmer than the late 19th century average.

This visualization shows how Earth has warmed since 1880. Red spirals indicate warmer than average temperatures.

Learn more: go.nasa.gov/3kcbPGc
See the data: go.nasa.gov/3ZqavzL
Jan 9, 2023 5 tweets 2 min read
Breathe deeply... and thank phytoplankton. Why? NASA researchers study these tiny creatures to better understand our changing planet. A thread (🧵): Phytoplankton are microscopic organisms that live in watery environments, both salty and fresh.
Jun 2, 2022 7 tweets 3 min read
Each year, strong winds carry more than a billion metric tons of mineral dust from Earth’s deserts and other dry regions through the atmosphere.

How does that dust affect the environment and climate? EMIT is launching soon to help us find out! Here are 5 things to know 👇 Officials from NASA and JPL... 1. It will identify the composition of mineral dust from Earth’s arid regions.

From its perch on the @Space_Station, EMIT will map the world’s mineral dust source regions, providing information on the color and composition of dust sources globally for the first time.
Mar 22, 2022 5 tweets 3 min read
Earth, the water planet. Its lakes, rivers, and oceans hold a crucial element for life. Earth-orbiting satellites help us track and better understand how this water moves around the globe. #WorldWaterDay Groundwater – hidden from plain sight – is a vital source of water that can be difficult to track. The GRACE-FO mission detects subtle changes in Earth’s gravity caused by the movement of water, like from groundwater and polar ice. go.nasa.gov/37SVSi3 Artist rendition of the two...
Mar 8, 2022 8 tweets 9 min read
Women have been working to study and understand our home planet from @NASA's very beginning. On #InternationalWomensDay2022 and all #WomensHistoryMonth, we’ll celebrate some of the women who help us see Earth more clearly. Group photo of the Ladies o... Dr. Kate Calvin is @NASA’s Chief Scientist and Senior Climate Advisor. She connects climate science across the agency so we can better understand how our planet is changing. #IWD2022 #InternationalWomensDay

go.nasa.gov/3pMWCeu Dr. Kate Calvin headshot
Jan 24, 2022 7 tweets 5 min read
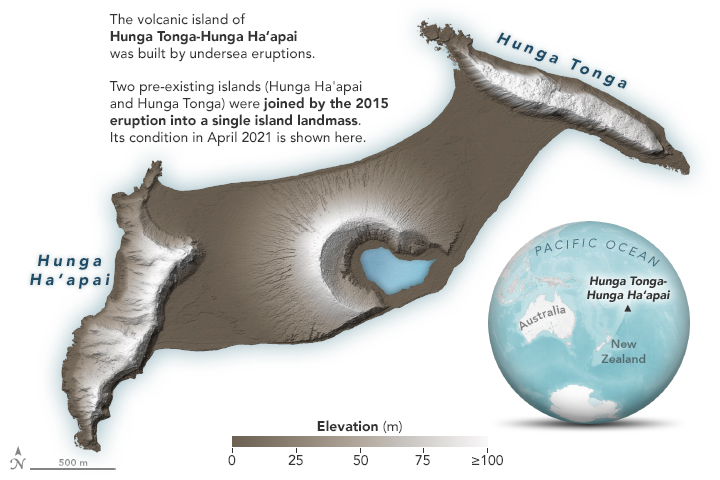
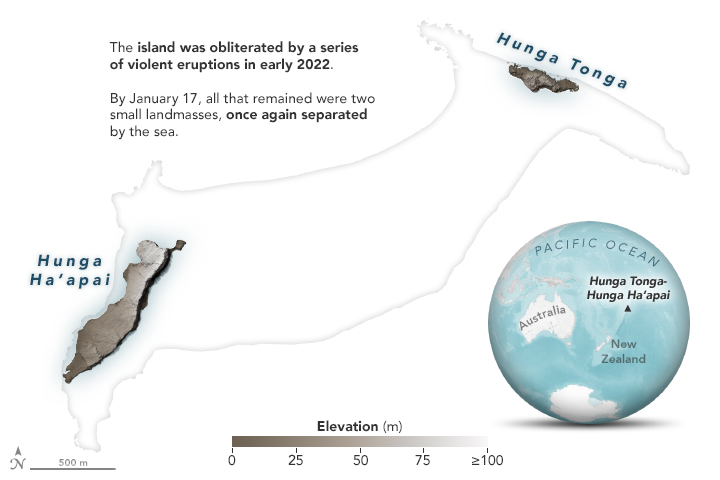
A mapping effort led by @NASAGoddard's chief scientist shows how the explosive volcanic eruption at #Tonga's #HungaTongaHungaHaapai obliterated the island. go.nasa.gov/3rE8jo4 “This is a preliminary estimate, but we think the amount of energy released by the eruption was equivalent to somewhere between 4 to 18 megatons of TNT,” said Jim Garvin. 🌋
Oct 18, 2021 6 tweets 3 min read
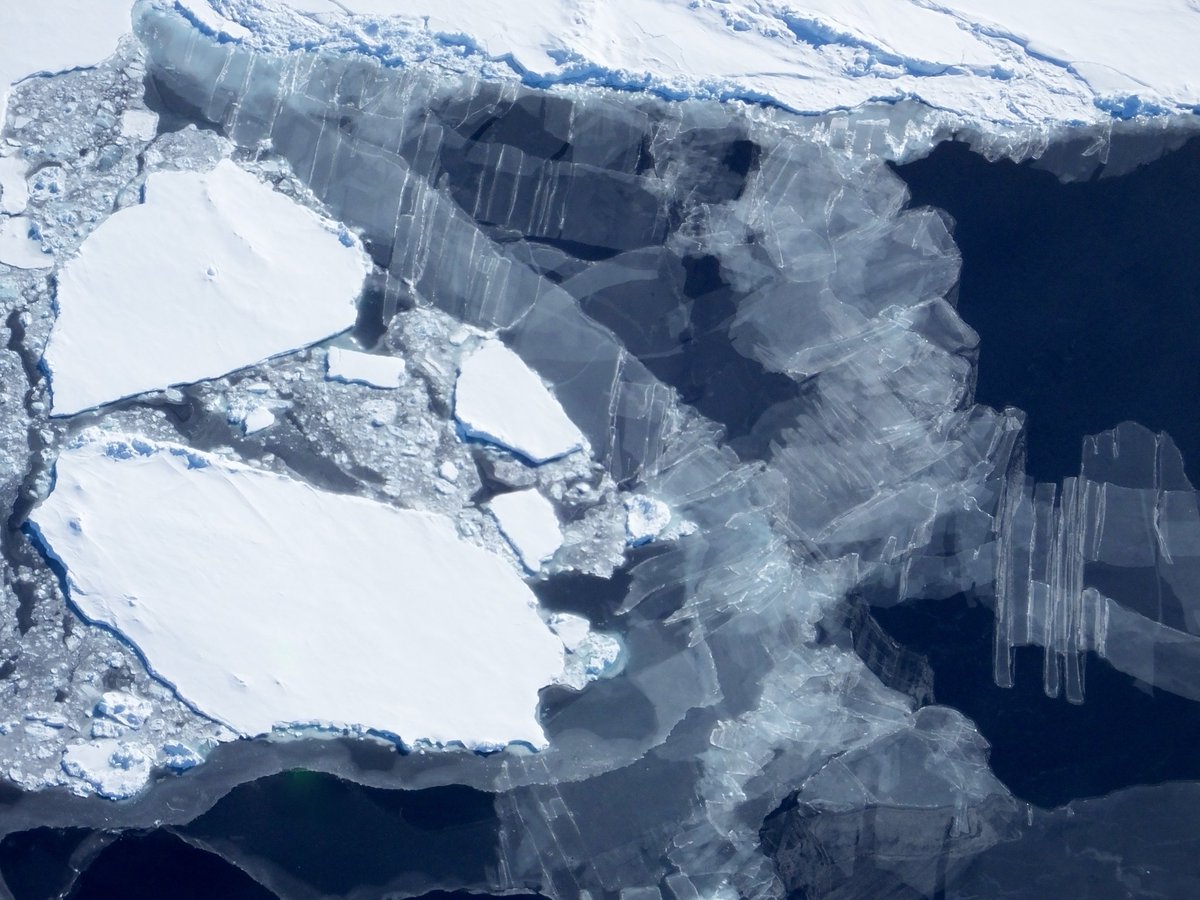
Earth’s ice can be divided into two categories: ice on land — like glaciers and ice sheets — and sea ice, which forms from frozen sea water. Sea ice plays an important role in regulating our planet’s temperature. Catch up with 5 fast facts about sea ice:
go.nasa.gov/3ja2s6j Picture from a plane of old... 1. Overall, sea ice extent is declining. Each year, sea ice grows and shrinks with the seasons. As global temperatures warm, the annual minimum extent of sea ice in the Arctic is declining, each year losing an area about the size of West Virginia. Graph of Arctic sea ice ext...
Aug 30, 2021 4 tweets 2 min read
Preliminary reports suggest #HurricaneIda is the fifth-strongest storm ever to make landfall in the continental U.S. earthobservatory.nasa.gov/images/148767/… “For me, the most compelling aspect of Ida was its rapid intensification up to landfall,” said Scott Braun, a scientist who specializes in hurricanes at NASA’s Goddard Space Flight Center.
Mar 25, 2021 6 tweets 4 min read
We now have the first continuous near real-time observations of how humans are increasing Earth’s greenhouse effect, developed by @NASA & university partners. The research directly demonstrates how human activities are responsible for changing the climate.
go.nasa.gov/3ck7PNf In the long run, all planets balance the energy they receive and the energy they emit back to space. Most of the energy coming from the Sun is shortwave radiation, or visible light. Energy absorbed by Earth warms the planet and longer wave (heat) energy is emitted back to space.
Feb 17, 2021 7 tweets 5 min read
The #CountdownToMars is on! We can hardly believe that the @NASAPersevere rover is just ONE day from touching down in Jezero Crater. 🎉

No one has set foot in the crater, but we have some ideas of what to expect thanks to Lake Salda in #Turkey. 🚀

earthobservatory.nasa.gov/blogs/earthmat… Take a close look at photos of these four key features found near Lake Salda. The Perseverance team hopes to find similar features on Mars. 👀
Jan 29, 2021 7 tweets 5 min read
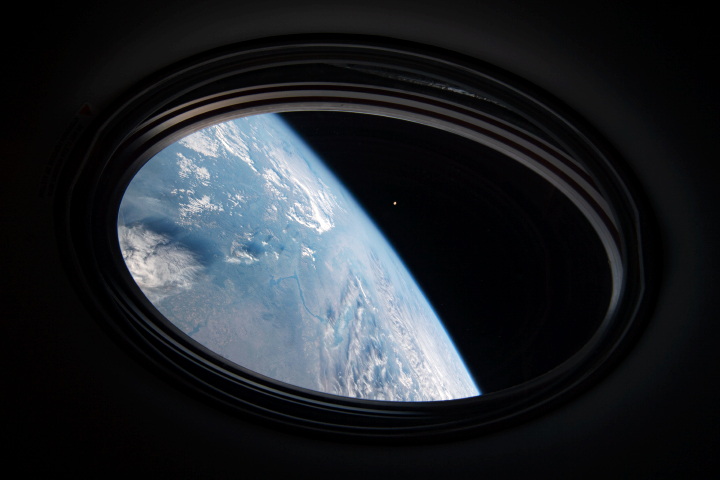
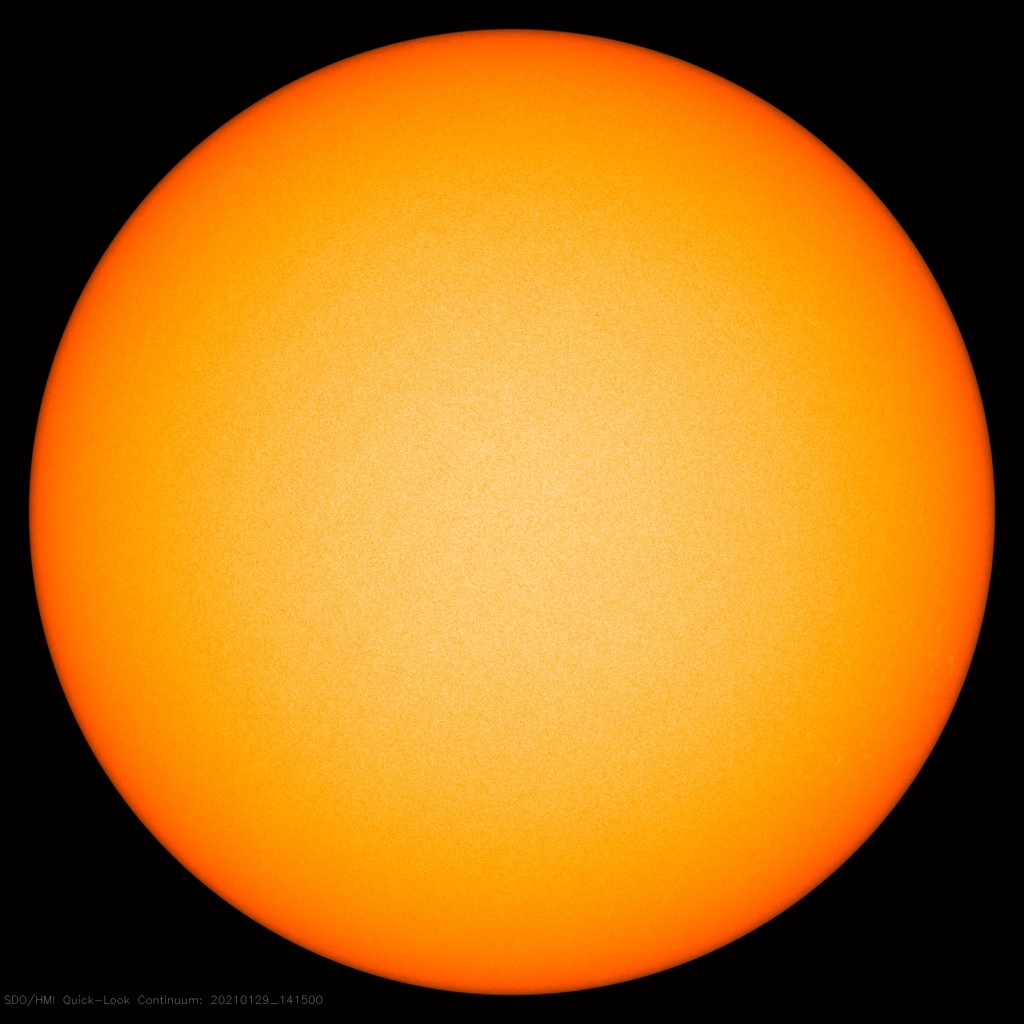
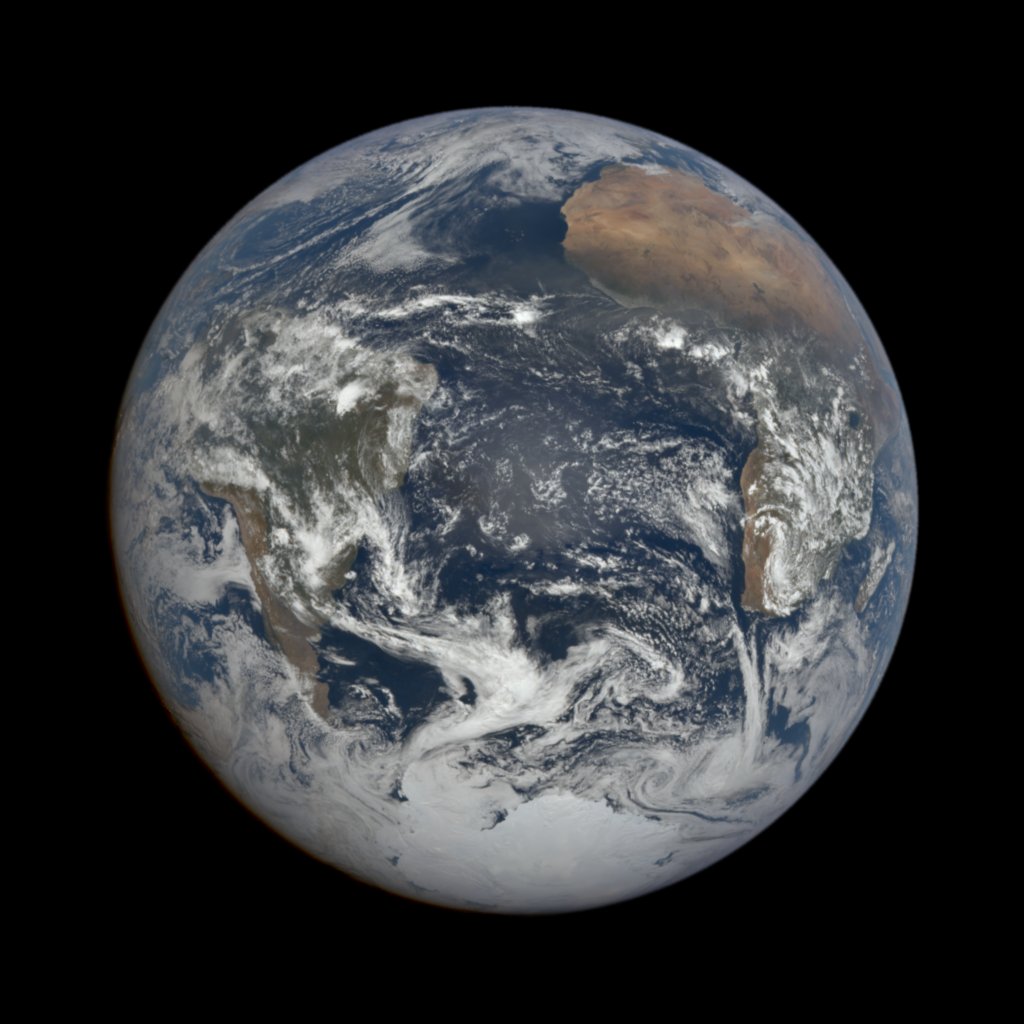
Earth is a big, weird place in space. There’s so much happening on this planet all at once that it’s easy to forget some minor details. We asked our friends here at @NASA — and we want to share with you — the facts about Earth that live rent free in our heads. Photo of the limb of Earth taken from a window in space Earth has a solid inner core that is almost as hot as the surface of the Sun. Earth’s core gets as hot as 9,800 degrees Fahrenheit, while the surface of the Sun is about 10,000 degrees Fahrenheit. Right, @NASASun?
solarsystem.nasa.gov/planets/earth/…
solarsystem.nasa.gov/solar-system/s… Image of the sunlit side of Earth from the Earth PolychromatImage of the Sun from the Solar Dynamics Observatory
Jan 27, 2021 4 tweets 3 min read
2020 was tied with 2016 for the warmest year on record, part of a long-term warming trend driven by human activity. @NASA works to monitor how our climate is changing — melting ice, warming temperatures, longer fire seasons, and more.
go.nasa.gov/2XDI6rh Recent NASA research has shown how the warming ocean is melting glaciers in Greenland.
go.nasa.gov/3c4pdWO
Combined, Greenland and Antarctica are losing 318 gigatons of ice per year. As the ice melts into the ocean, sea levels rise globally.
go.nasa.gov/3cb0bCC
Jan 14, 2021 8 tweets 5 min read
Globally, 2020 was the hottest year on record, effectively tying 2016, the previous record. Overall, Earth’s average temperature has risen more than 2 degrees F since the 1880s. The effects of rising temperatures are felt around the world.
go.nasa.gov/3iakW5c 2020 was a year of extremes, with record-breaking hurricane and fire seasons. Higher surface temperatures and more heat in the climate system can fuel different extreme events, directly and indirectly, like increasing tropical storm intensity.
Nov 10, 2020 8 tweets 5 min read
We know that as human activity warms the planet, global sea level is rising. We know that about 2/3 of sea level rise so far has come from melting ice. But how do we know this? We can measure it from space.
#SeeingTheSeas Visualization of sea level rise mapped around the planet on Sea level isn’t uniform around the planet. Tides and currents, the density and temperature of water, and landforms can affect where the ocean piles up. We know this because we measure the shape of the ocean using radar altimetry.
go.nasa.gov/3n0EpGB Graph of sea level rise measurements from the tide gauge rec
Nov 9, 2020 4 tweets 2 min read
The effects of sea level rise come in many forms. During tropical storms, higher sea levels drive intense storm surges — water level much higher than normal tides. But with sea level rise, the tides themselves can cause flooding.

#SeeingTheSeas During high-tide floods, water can make its way from the ocean onto land and bubble up from storm drains. In cities like Miami & Annapolis, high-tide flooding can close down streets & businesses, and damage infrastructure like pipes & wastewater systems.
go.nasa.gov/3eISZj9
Nov 8, 2020 6 tweets 3 min read
Sea levels on the West Coast of the United States are rising at a faster rate than the global average – and that trend is likely to continue for at least a few years, with likely effects for people living in the region.
#SeeingTheSeas
go.nasa.gov/3n2Kxy7 The height of the sea surface in the western and eastern tropical Pacific Ocean seesaws over time – when one is higher, the other is lower. This is driven on shorter timescales by two natural climate patterns: the El Niño-Southern Oscillation and the Pacific Decadal Oscillation.
Oct 13, 2020 4 tweets 4 min read
#HurricaneDelta was the 25th named Atlantic storm of the 2020 hurricane season. After exhausting a list of prepared names, @WMO turns to the Greek alphabet to name storms. Hurricanes typically get a massive boost of energy when they pass over warm waters. #HurricaneDelta rapidly intensified to a Category 4 storm. #HurricaneLaura also underwent rapid intensification in the Gulf of Mexico.
go.nasa.gov/2GTxb7V Natural color satellite image of Hurricane Delta making landImage of Hurricane Delta making landfall with ocean colored
Sep 21, 2020 5 tweets 4 min read
Arctic sea ice reached its second-lowest minimum extent on record on Sept. 15, 2020. This year’s extent was larger only than 2012’s extent. @NASA and @NSIDC track sea ice through the year.
go.nasa.gov/33LwmFH Sea ice plays an important role in keeping our planet cool. Light-colored ice reflects heat from the Sun back into the atmosphere, while darker ocean water absorbs it, so warming accelerates as sea ice extent declines.
May 6, 2020 40 tweets 3 min read
318 gigatons.
That’s how much ice is lost every year from Antarctica and Greenland’s ice sheets, according to new science from @NASA_Ice's #ICESat2. go.nasa.gov/3cb0bCC

But… how much ice is that, really? 🤔 Let's say 🧊= a gigaton of ice.

🧊 would be enough to cover NYC’s Central Park in ice past the top of the Chrysler Building. When melted, it would fill 400,000 Olympic-sized swimming pools.

Each year from 2003 to 2019, Greenland lost 200 🧊s. Antarctica lost 118 🧊s.
Jan 15, 2020 6 tweets 3 min read
2019 was the second hottest 🌡 year and the last decade was the warmest decade on record. The global average temperature was more than 2°F warmer than during the late 19th century.
go.nasa.gov/2RnffDZ Scientists at @NASA and @NOAA separately analyze temperature measurements taken at thousands of weather stations, ships and ocean buoys around the globe. Although the records differ slightly due to data processing, they both show a long-term pattern 📈 of increasing temperature.