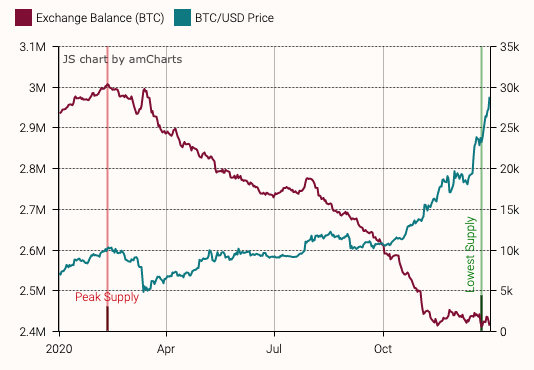
#Bitcoin supply began to squeeze in October 2020 when looking at available supply on exchanges, according to data by @glassnode. Last year saw over 600k #BTC leaving exchanges. 1/7 
But for anyone taking notice of what's happening with #USDT would have noticed the signs very early on. Exchange balances for Tether broke the $2bn as the sell-off took place in March. But they remained on exchanges waiting to buy once again. 2/7
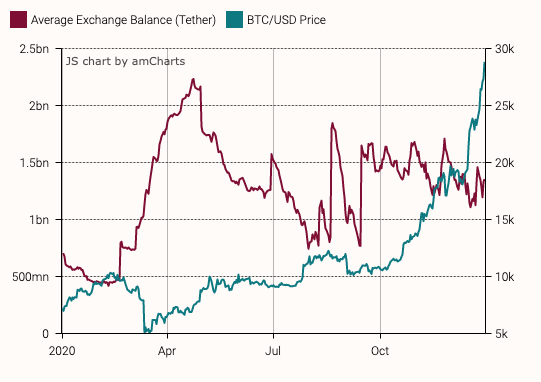
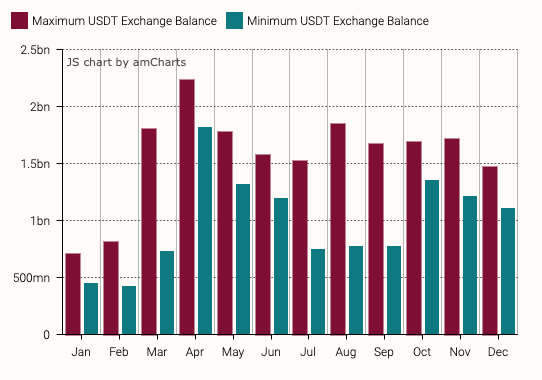
By the end of the year, Glassnode data shows that the amount of Tether sitting on exchanges had doubled versus the start of the year. 3/7
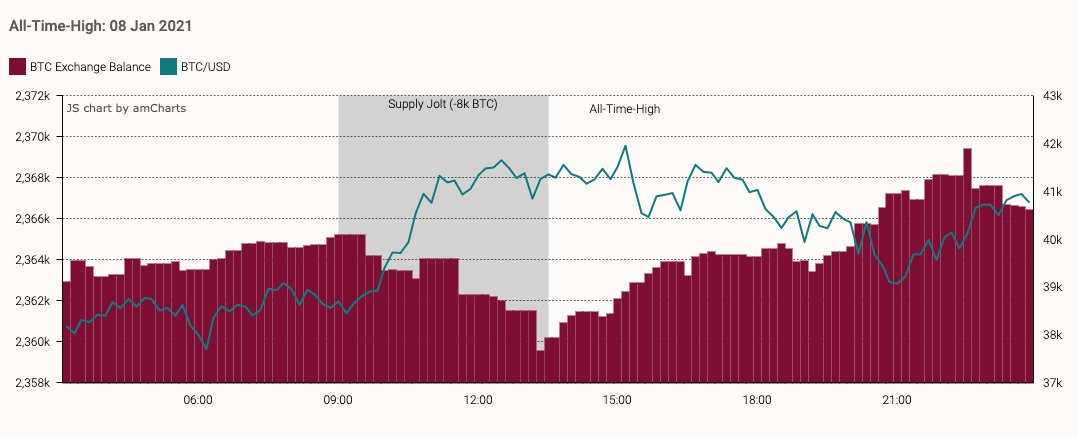
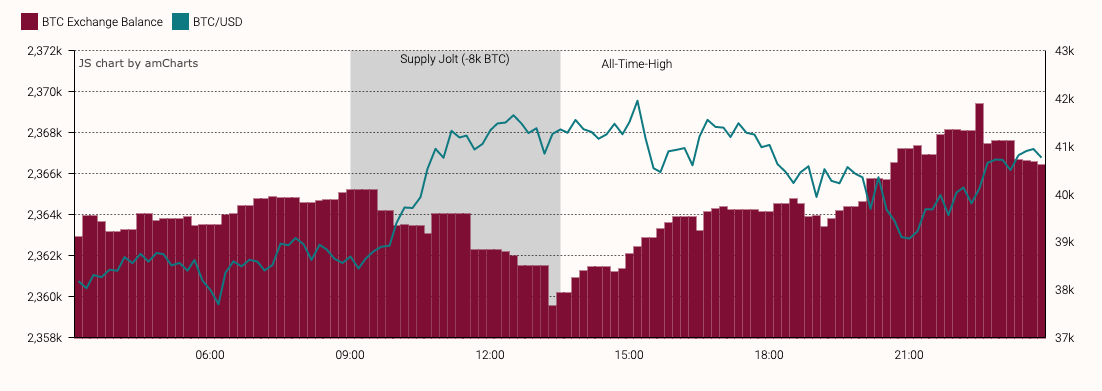
What's important for traders is to see how they can take advantage of blockchain data in the long-term and the short term. The possibilities of seeing movements early are quite easy. Take for example the All-Time-High for #BTC. An 8k in supply dropped hours before the peak. 4/7
Or take a large negative swing too. A huge increase in supply on exchange led to #Bitcoin dropping by $8000 on Jan-11. Short sellers would have been wise to protect themselves. Buyers could have been ready to jump on the dip. 5/7

You can read more about this research here 6/7: blog.zubr.io/bitcoin-to-exc…
And because we want to see our traders win, we're giving new sign-ups a month free of @glassnode Advanced data. You can find out more about the offer and the deposit bonus here: welcome.zubr.io/glassnodes/
• • •
Missing some Tweet in this thread? You can try to
force a refresh