Ct values can be used to estimate epidemic dynamics UPDATE! Ct values are expected to change depending on whether the epidemic is growing or declining, and we harness this to estimate the epidemic trajectory. Lots of cool new analyses and methods! 1/12

medrxiv.org/content/10.110…
Highlights:
- Cts from symptom-based surveillance change over time, but the effect is weaker
- Methods to infer incidence using single cross-sections of Cts
- Unbiased by changing testing coverage
- Gaussian process (wiggly line) model for incidence tracking using Ct values
2/12
This work is *JOINTLY led* with @LeekShaffer and PI’d by @michaelmina_lab. Thank you also to the ever insightful @mlipsitch and to coauthors @SanjatKanjilal @gabriel_stacey and @nialljlennon. 3/12
Premise: times since infection depend on the epidemic trajectory. Distributions of randomly sampled viral loads proxy times since infection. With calibration, Ct values can estimate growth rate. We focus on qPCR in SARS-CoV-2, but the principle applies to any outbreak. 4/12
Result 1: viral loads are shifted higher (Cts lower) during epidemic growth and lower (Cts higher) during decline when individuals are sampled *based on the onset of symptoms*. We simulated linelist data under symptom-based surveillance and looked at TSI and Cts over time. 5/12
This is crucial when considering virulence in emerging SARS-CoV-2 variants. Lower Cts over time do not *necessarily* mean newly dominant variants have higher virulence. If incidence of a new variant is increasing, then we expect to see more recent infections and lower Cts. 6/12
**However, the effect is smaller than under random surveillance, so I would not rule out the possibility of increased virulence.** But important to consider. Thank you to @charliewhittak for chatting through this! 7/12
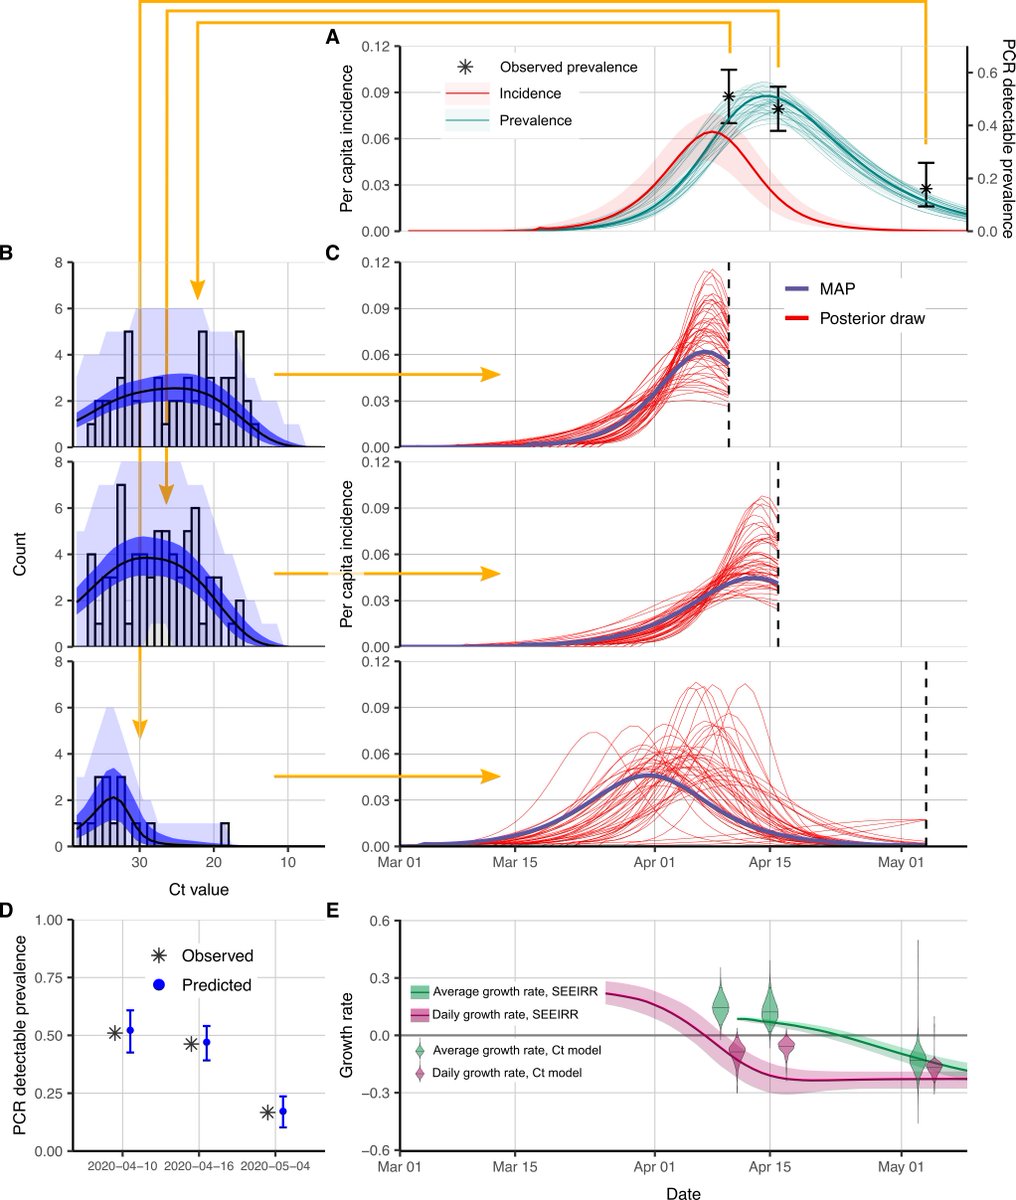
Result 2: we reconstructed the epidemic curve using single-cross sectional samples from well-observed nursing homes, finding that single cross sections using the full Ct distribution provided similar insights to point prevalence across three sample times. 8/12 (A) shows standard compartmental model fit to 3 point preval
Result 3: we compared Ct-based to case-count based methods when testing is changing. Rt estimates are biased when testing is increasing or decreasing (not a problem with the method, just the data!). Our method uses the Ct distribution so does not care about test numbers. 9/12
Result 4: we use multiple cross-sectional samples to reconstruct incidence without making assumptions about the trajectory shape (a Gaussian “wiggly” process model). We can track the incidence curve in MA using routinely collected hospital tests. 10/12
… and here is a gif that reminds me of a nematode worm. Every week we add on a new cross section of Cts and accurately track true incidence (in simulation, red line). 11/12
Conclusion: we are generating loads of (semi) quantitative data in the form of Cts. We can harness these to get unbiased estimates of the epidemic trajectory. Hopefully these ideas will help public health surveillance efforts and interpret data in the light of new variants. 12/12
Individuals tested due to recent symptom onset are more likely to have been recently infected with a short incubation period during epidemic growth than during epidemic decline, where more onsets are from older infections with longer incubation periods.

journals.plos.org/ploscompbiol/a…

• • •

Missing some Tweet in this thread? You can try to force a refresh
 

Keep Current with James Hay

James Hay Profile picture

Stay in touch and get notified when new unrolls are available from this author!

Read all threads

This Thread may be Removed Anytime!

PDF

Twitter may remove this content at anytime! Save it as PDF for later use!

Try unrolling a thread yourself!

how to unroll video
  1. Follow @ThreadReaderApp to mention us!

  2. From a Twitter thread mention us with a keyword "unroll"
@threadreaderapp unroll

Practice here first or read more on our help page!

More from @jameshay218

14 Oct 20
Ct values can be used to estimate epidemic dynamics! We show that the distribution of viral loads changes during an epidemic and develop a new method to infer growth rates from cross-sectional virological surveys without using reported case counts.

1/25

medrxiv.org/content/10.110…
Highlights:
- The distribution of observed viral loads is determined by recent incidence trends
- The median and skew of detectable Cts in Massachusetts were correlated with R(t), as predicted
- A novel statistical method to infer the epidemic growth rates using Ct values

2/25
Cts are inversely proportional to log viral loads. The relationship depends on the instrument and sampling variation, but low Cts generally indicate high viral loads. Think about expectations & distributions rather than individual measurements

academic.oup.com/cid/advance-ar…

3/25
Read 25 tweets
7 Oct 20
Very excited to share our updated preprint on pooled testing for SARS-CoV-2 surveillance. This has been a fantastic modeling and lab collaboration with @BrianCleary, @michaelmina_lab and Aviv Regev, and it’s all about our favorite topic: viral loads. 1/16

medrxiv.org/content/10.110…
Highlights:
-PCR sensitivity and efficiency are linked to epidemic dynamics and viral kinetics
-Prevalence estimation without testing individual samples using a few dozen tests
-Simple (by hand) strategies optimized for resource-constrained settings

Full story below. 2/16
We (the world) still need more testing. The number of test kits is still limited in a lot of places, meaning that we are missing a lot of infections, not testing regularly, and are flying blind wrt population prevalence. Pooling has been discussed as part of the solution. 3/16
Read 18 tweets
27 Mar 20
The lack of clinical COVID19 cases in children is odd. Understanding why will be essential in deciding which social interventions are most useful. We discussed this alongside a modeling analysis here: dash.harvard.edu/handle/1/42639…
@DrDJHaw @BillHanage @CJEMetcalf @michaelmina_lab
We propose 4 possible explanations for the lack of cases in children:

1) Kids haven’t been making as many contacts as normal. This may contribute, but probably isn’t the only factor: medrxiv.org/content/10.110…
2) Children are less susceptible to *infection* or adults are more susceptible. Seems unlikely now, given secondary attack rates from contact tracing, though conflicting findings: medrxiv.org/content/10.110… + previous
Read 10 tweets
25 Mar 20
A recent analysis from Oxford presented a range of model scenarios consistent with observed COVID death counts. I’m going to reproduce their analysis here and then present some slight modifications to provide a conservative (if technical) perspective. (gonna be 15ish tweets)
They showed you can estimate the same number of deaths with either a high % of the population at risk of severe disease and a recent epidemic start, or a low % and an earlier start. Some media outlets have reported this as suggesting “majority of the UK has already been infected”
But that’s *not* what the authors were trying to say. The aim was: given what we do know about the virus, let’s test different assumptions for the stuff we don’t know and see which tests are consistent with observed death counts.
Read 20 tweets
7 Mar 20
Total isolation isn’t the only way to reduce #coronavirus spread. Reducing unnecessary contacts (only invite the best people to your birthday party) helps. Based on school maths: if you roll a die 10 times, the probability of 1 or more 6s is 84%. If you roll it twice, it’s 31%.
This also applies if you reduce the nature of your contacts. For example, if you stop licking your friend’s face, maybe you go from a 6-sided die to a 20-sided die. Then the probability of at least 1 20 at your 2-mate birthday party goes down to 10%.
Even partial reduction goes a long way to reducing transmission below a critical threshold. R0 = prob of transmission on contact * infectious duration * contact rate. If we have R0 = 2 = 0.04*5*10, then halving the contact rate gets us to 0.04*5*5 = 1.
Read 4 tweets

Did Thread Reader help you today?

Support us! We are indie developers!


This site is made by just two indie developers on a laptop doing marketing, support and development! Read more about the story.

Become a Premium Member ($3/month or $30/year) and get exclusive features!

Become Premium

Too expensive? Make a small donation by buying us coffee ($5) or help with server cost ($10)

Donate via Paypal Become our Patreon

Thank you for your support!

Follow Us on Twitter!