We’ve published analysis showing how industries related to travel and tourism in the UK have been affected by #COVID19.

The bulletin uses ONS statistics on business performance and the Labour market as well as other external data sources ow.ly/m0H950DAl0z
#COVID19 has affected the travel and tourism sector heavily in 2020 and 2021.

Government restrictions both in the UK and worldwide have prevented tourism for large periods of time ow.ly/saoL50DAl1r
Our Business Impact of Coronavirus Survey (BICS) revealed most travel and tourism industries had a higher percentage of people on furlough leave than other industries.

These industries were also more responsive to changes in lockdown restrictions ow.ly/B7N950DAl56
The BICS survey also showed the proportion of businesses in travel and tourism industries trading peaked at 85% in October 2020, before declining in response to increasing restrictions in November ow.ly/bsvm50DAl8a Figure 5: The proportion of...
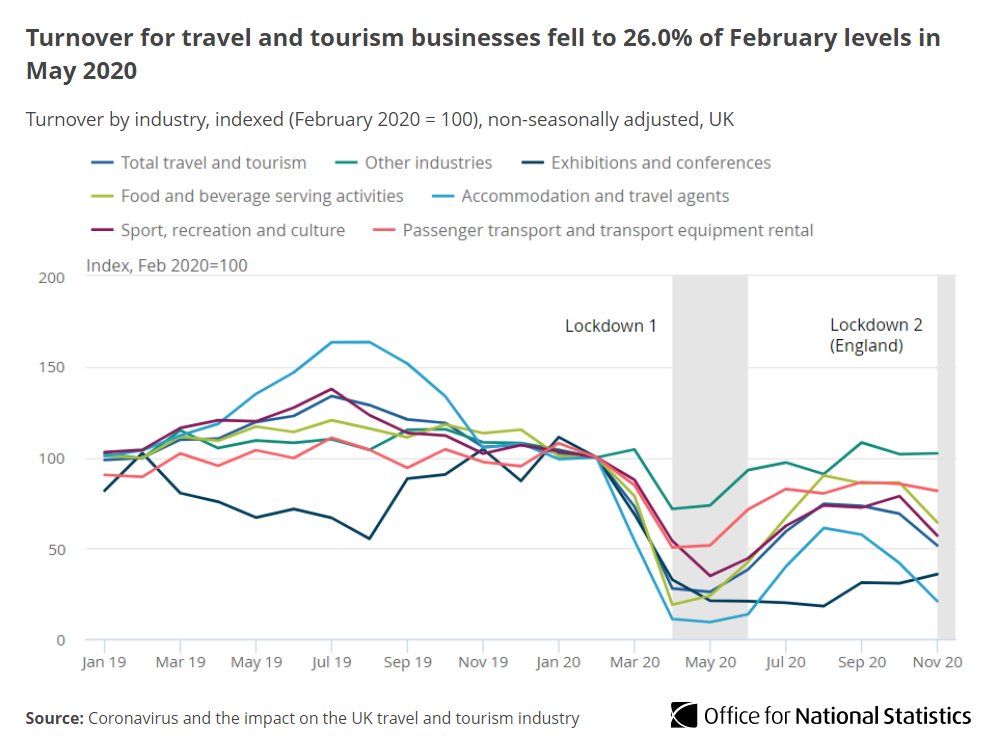
Data from our MBS (Monthly Business Survey) show turnover for travel and tourism businesses fell to 26.0% of February levels in May 2020 ow.ly/7bvE50DAla8 Figure 4: Turnover for trav...
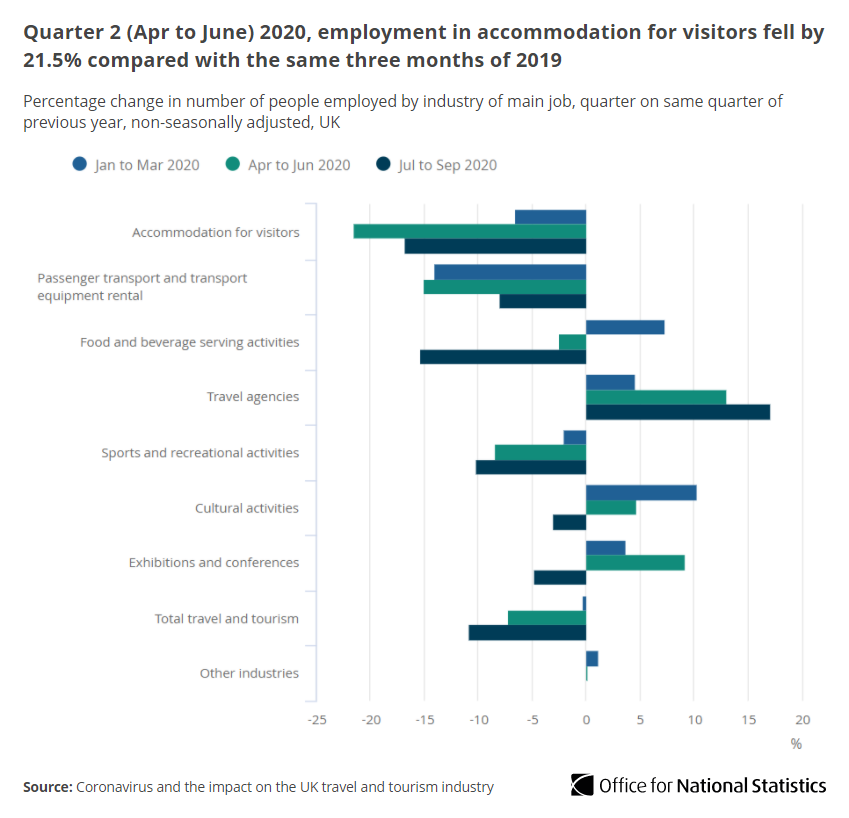
Our Labour Force Survey data shows those who reported their main job as being in the travel and tourism industry during Quarter 3 2020 was 10.8% lower than the same time in 2019.

Over the same period, employment in other industries increased by 0.1% ow.ly/5ibf50DAlcu Figure 6: Quarter 2 (Apr to...
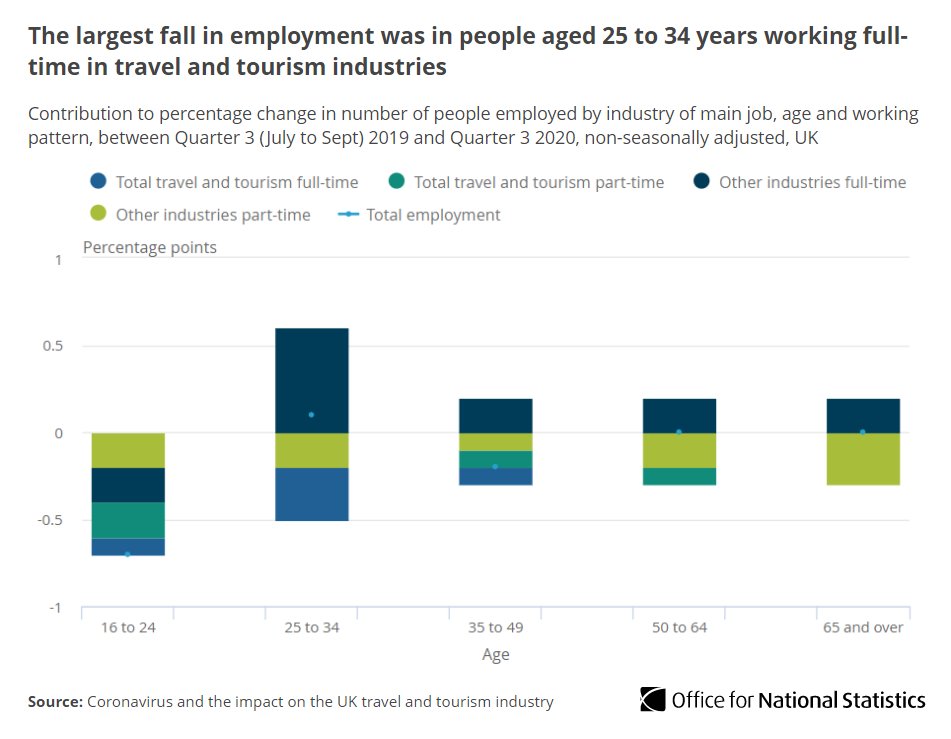
The largest fall in employment in travel and tourism industries was for people aged 25-34 working full time ow.ly/JMbb50DAleP Figure 8: The largest fall ...
Data from @UK_CAA show how international passenger traffic at UK airports fell to 1.9% of its February 2020 levels in April.

This recovered to a peak of 36.7% in August before falling again in response to increased restrictions ow.ly/7fiL50DAliS Figure 1: Domestic and inte...
.@ukhomeoffice data show International passenger arrivals fell from 6.8 million in February to 112,300 in April 2020, of which 56.5% were British nationals.

This is an increase of 5.6 percentage points on the proportion in February ow.ly/ENyN50DAlnd
Data released by GetLink, the operator of EuroTunnel, show how traffic through the tunnel has changed this year ow.ly/zvtb50DAlp5
In April 2020, only 19,862 passenger vehicles travelled, compared to 227,393 in the same month in 2019, a decrease of 91.3%.

This includes cars, motorcycles, vehicles with trailers, caravans, camper vans and coaches ow.ly/kX3u50DAlr4
Hotel occupancy data from @VisitEngland show Greater London saw the largest fall in room occupancy of any English region from 2019 to 2020, with just 20% of rooms occupied in July 2020.

This is compared to 90% in the same month in 2019 ow.ly/s6Ia50DAlud

• • •

Missing some Tweet in this thread? You can try to force a refresh
 

Keep Current with Office for National Statistics (ONS)

Office for National Statistics (ONS) Profile picture

Stay in touch and get notified when new unrolls are available from this author!

Read all threads

This Thread may be Removed Anytime!

PDF

Twitter may remove this content at anytime! Save it as PDF for later use!

Try unrolling a thread yourself!

how to unroll video
  1. Follow @ThreadReaderApp to mention us!

  2. From a Twitter thread mention us with a keyword "unroll"
@threadreaderapp unroll

Practice here first or read more on our help page!

More from @ONS

16 Feb
The provisional number of deaths registered in England and Wales in the week ending 5 February 2021 (Week 5) was 17,192.

This was
▪️ 1,256 fewer than Week 4
▪️ 4,986 higher than the five-year average for Week 5

➡️ ow.ly/TcmE50DBhNI Chart showing the number of...
Of the 17,192 deaths registered in Week 5, 7,320 mentioned #COVID19 on the death certificate (42.6% of all deaths).

This has fallen by 1,113 #COVID19 deaths since the previous week ow.ly/KYVw50DBhQG Chart showing the number of...
Of the 7,320 deaths involving #COVID19, 89.1% had this recorded as the underlying cause of death.

Of the 4,993 deaths involving influenza and pneumonia, 6.1% had these as the underlying cause ow.ly/1AQs50DBhSu
Read 9 tweets
2 Feb
We’ve published Quarterly alcohol-specific deaths in England and Wales, showing 2001 to 2019 registrations and Quarter 1 (Jan to Mar) to Quarter 3 (July to Sept) 2020 provisional registrations ow.ly/qoc150DoLk5
Provisional data for England and Wales show there were 5,460 deaths from alcohol-specific causes registered in the first three quarters of 2020 (Jan to Sept).

This is a 16.4% increase compared to the same nine-month period in 2019 ow.ly/VQsZ50DoLlp
The alcohol-specific death rate of 12.8 deaths per 100,000 deaths in Quarter 1 2020 (Jan to Mar) was statistically similar to previous years ow.ly/sAH050DoLo1
Read 7 tweets
22 Jan
Our weekly overview of #COVID19 measures in England with the Joint Biosecurity Centre and @PHE_uk uses multiple data sources to improve understanding of the pandemic, including

•infections
•hospital admissions
•deaths
•behaviours
•antibodies

ow.ly/iG8g50DfpDH Coronavirus (COVID-19) weekly insights: latest health indica
In England, infection rates and hospital admissions rates remain high while deaths involving #COVID19 have increased ow.ly/VvKY50DfpLY Charts showing infection rates and hospital admissions remai
The highest hospital admission rates in England were recorded in the West Midlands, while Yorkshire and The Humber recorded the lowest rates in the most recent week.

The South East recorded the highest number of deaths involving #COVID19 ow.ly/F2DN50DfpRk Chart showing hospital admissions and deaths involving COVID
Read 4 tweets
22 Jan
We’ve produced our latest estimates for the level of #COVID19 infection rates across the UK ow.ly/RTVZ50DfoKG Graphic text: Estimated number of people who had COVID-19 in
Our latest estimate for England suggests the #COVID19 infection rate remains high but has decreased slightly.

Around 1 in 55 people not in care homes, hospitals or other institutional settings had #COVID19 in the week ending 16 January ow.ly/KL1C50DfoMJ Figure 1: In England, the percentage of people testing posit
In England, London and the North East had the highest infection rates in the week ending 16 January.

We estimate that in London, 1 in 35 people had #COVID19 ow.ly/A0q050DfoP0 Figure 4: London and the North East had the highest percenta
Read 8 tweets
22 Jan
We've published new data from the Opinions and Lifestyle Survey, including questions about feelings towards the #COVID vaccine, mass testing, and the future.

Findings are from 13 to 17 January ow.ly/qDbg50Dfhiu Coronavirus and the social impacts on Great Britain: 22 Janu
There appears to be more positive attitude to the #COVID19 vaccine, with 90% reporting they’d received the vaccine, accepted an offer, or would likely accept if offered ow.ly/hkAn50DfhnG Line chart showing around 9 in 10 adults have now received t
Adults reporting they would be likely to have the #COVID19 vaccine if offered appeared to increase with age, rising from 81% among 16 to 29 year-olds to 98% among those aged 70 years and over ow.ly/JV6450Dfhrw Stacked bar chart showing around 8 in 10 (81%) of adults age
Read 6 tweets
22 Jan
Our latest data show that retail sales increased by an estimated 0.3% in December 2020 ow.ly/LDC950DfcXo Graphic:   Retail sales grew 0.3% in December  Compared with
Commenting on today’s retail sales figures, Deputy National Statistician for Economic Statistics @jathers_ONS said:
(1/4) December’s retail sales increased slightly, driven by an i
.@jathers_ONS continued: (2/4) Food store sales this month were subdued as retailers report
Read 8 tweets

Did Thread Reader help you today?

Support us! We are indie developers!


This site is made by just two indie developers on a laptop doing marketing, support and development! Read more about the story.

Become a Premium Member ($3/month or $30/year) and get exclusive features!

Become Premium

Too expensive? Make a small donation by buying us coffee ($5) or help with server cost ($10)

Donate via Paypal Become our Patreon

Thank you for your support!

Follow Us on Twitter!