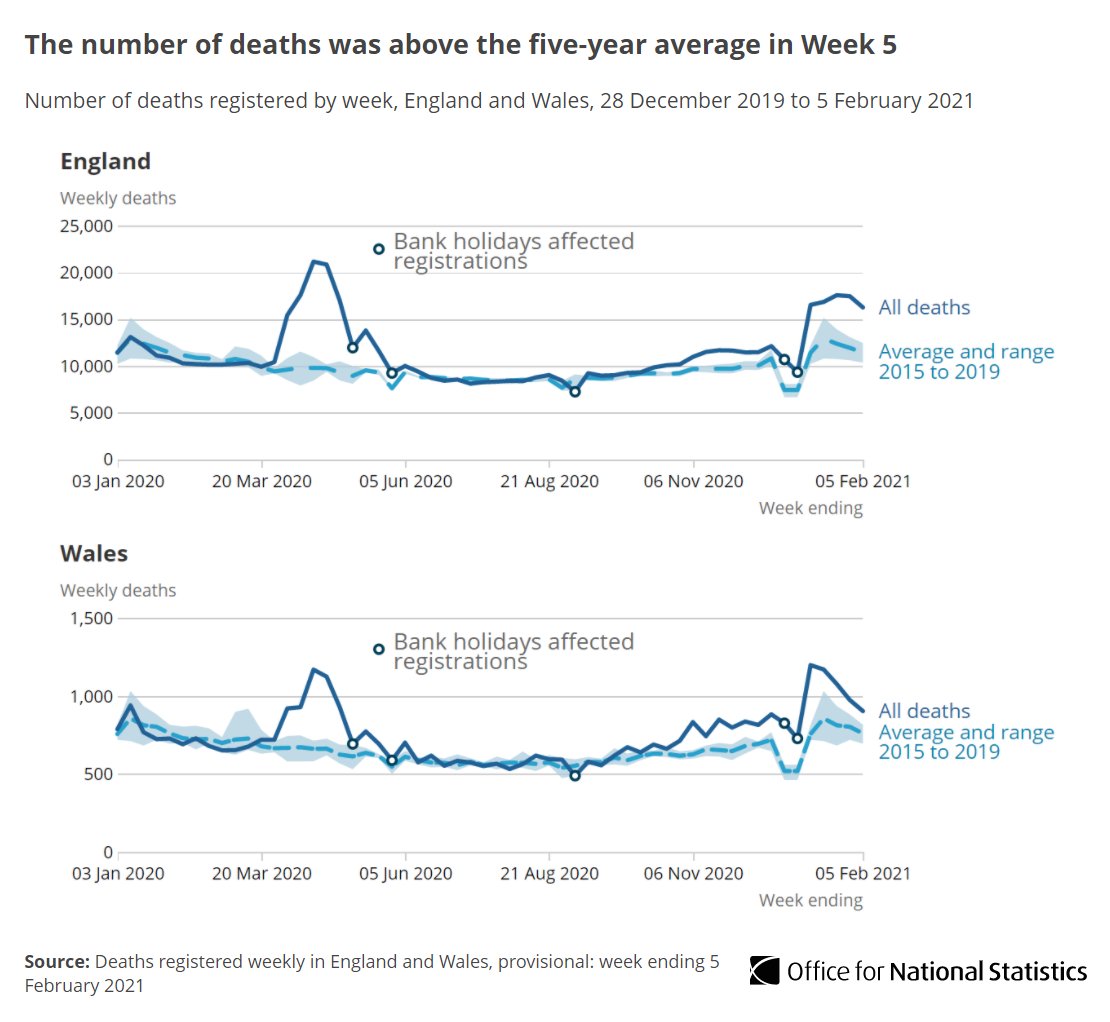
The provisional number of deaths registered in England and Wales in the week ending 5 February 2021 (Week 5) was 17,192.

This was
▪️ 1,256 fewer than Week 4
▪️ 4,986 higher than the five-year average for Week 5

➡️ ow.ly/TcmE50DBhNI Chart showing the number of deaths was above the five-year a
Of the 17,192 deaths registered in Week 5, 7,320 mentioned #COVID19 on the death certificate (42.6% of all deaths).

This has fallen by 1,113 #COVID19 deaths since the previous week ow.ly/KYVw50DBhQG Chart showing the number of deaths involving COVID-19 decrea
Of the 7,320 deaths involving #COVID19, 89.1% had this recorded as the underlying cause of death.

Of the 4,993 deaths involving influenza and pneumonia, 6.1% had these as the underlying cause ow.ly/1AQs50DBhSu
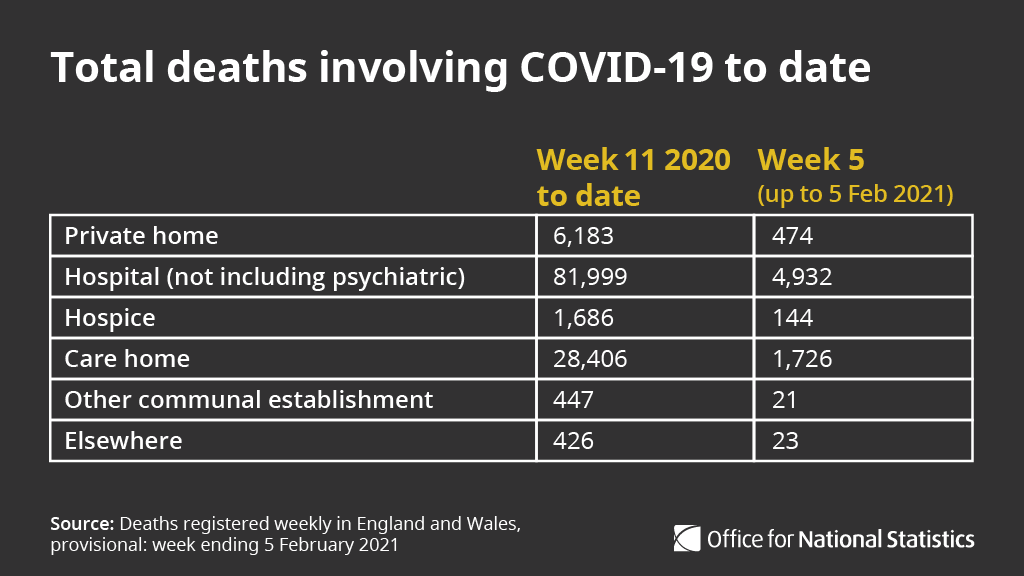
Of deaths involving #COVID19 registered in 2020 and up to Week 5, 81,999 deaths (68.8%) occurred in hospitals.

The remainder mainly occurred in

▪️ care homes (28,406)
▪️ private homes (6,183)
▪️ hospices (1,686)

➡️ ow.ly/QUx850DBhXP Total deaths involving COVID-19 to date   Deaths (Week 11 20
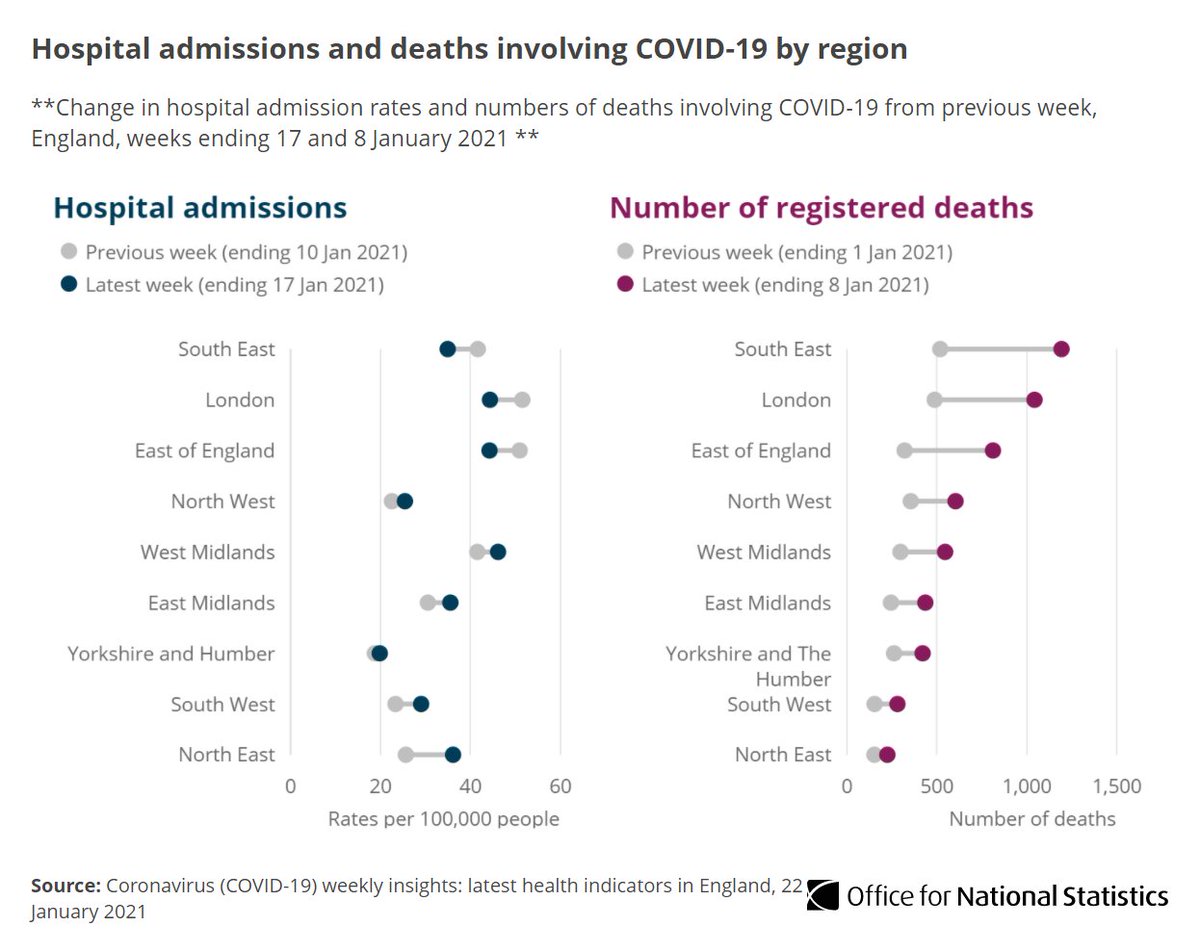
The number of deaths involving #COVID19 decreased in all English regions.

The South East of England recorded the largest decrease ow.ly/nipF50DBi5F
In Wales, deaths registered involving #COVID19 in Week 5 was 314.

This has fallen since the previous week (361 deaths) ow.ly/AyUa50DBi8H
In England, 114,690 deaths that occurred up to 5 Feb 2021 (registered up to 13 February) involved #COVID19.

@PHE_uk reported 100,664 #COVID19 death occurrences in this time (notified by 15 Feb, where death occurred within 28 days of a positive test) ow.ly/wWxw50DBidu
In Wales, 7,089 deaths that occurred up to 5 Feb 2021 (registered up to 13 Feb) involved #COVID19.

@PublicHealthW reported 5,036 #COVID19 death occurrences in this time, where the death occurred within 28 days of testing ow.ly/8azJ50DBigp
ONS figures are based on deaths registered up to 13 February 2021 (and may rise as more deaths are registered).

@PHE_uk report on date of notification and death reported up to 5pm the day before ow.ly/FNxn50DBikC

• • •

Missing some Tweet in this thread? You can try to force a refresh
 

Keep Current with Office for National Statistics (ONS)

Office for National Statistics (ONS) Profile picture

Stay in touch and get notified when new unrolls are available from this author!

Read all threads

This Thread may be Removed Anytime!

PDF

Twitter may remove this content at anytime! Save it as PDF for later use!

Try unrolling a thread yourself!

how to unroll video
  1. Follow @ThreadReaderApp to mention us!

  2. From a Twitter thread mention us with a keyword "unroll"
@threadreaderapp unroll

Practice here first or read more on our help page!

More from @ONS

15 Feb
We’ve published analysis showing how industries related to travel and tourism in the UK have been affected by #COVID19.

The bulletin uses ONS statistics on business performance and the Labour market as well as other external data sources ow.ly/m0H950DAl0z
#COVID19 has affected the travel and tourism sector heavily in 2020 and 2021.

Government restrictions both in the UK and worldwide have prevented tourism for large periods of time ow.ly/saoL50DAl1r
Our Business Impact of Coronavirus Survey (BICS) revealed most travel and tourism industries had a higher percentage of people on furlough leave than other industries.

These industries were also more responsive to changes in lockdown restrictions ow.ly/B7N950DAl56
Read 12 tweets
2 Feb
We’ve published Quarterly alcohol-specific deaths in England and Wales, showing 2001 to 2019 registrations and Quarter 1 (Jan to Mar) to Quarter 3 (July to Sept) 2020 provisional registrations ow.ly/qoc150DoLk5
Provisional data for England and Wales show there were 5,460 deaths from alcohol-specific causes registered in the first three quarters of 2020 (Jan to Sept).

This is a 16.4% increase compared to the same nine-month period in 2019 ow.ly/VQsZ50DoLlp
The alcohol-specific death rate of 12.8 deaths per 100,000 deaths in Quarter 1 2020 (Jan to Mar) was statistically similar to previous years ow.ly/sAH050DoLo1
Read 7 tweets
22 Jan
Our weekly overview of #COVID19 measures in England with the Joint Biosecurity Centre and @PHE_uk uses multiple data sources to improve understanding of the pandemic, including

•infections
•hospital admissions
•deaths
•behaviours
•antibodies

ow.ly/iG8g50DfpDH Coronavirus (COVID-19) weekly insights: latest health indica
In England, infection rates and hospital admissions rates remain high while deaths involving #COVID19 have increased ow.ly/VvKY50DfpLY Charts showing infection rates and hospital admissions remai
The highest hospital admission rates in England were recorded in the West Midlands, while Yorkshire and The Humber recorded the lowest rates in the most recent week.

The South East recorded the highest number of deaths involving #COVID19 ow.ly/F2DN50DfpRk Chart showing hospital admissions and deaths involving COVID
Read 4 tweets
22 Jan
We’ve produced our latest estimates for the level of #COVID19 infection rates across the UK ow.ly/RTVZ50DfoKG Graphic text: Estimated number of people who had COVID-19 in
Our latest estimate for England suggests the #COVID19 infection rate remains high but has decreased slightly.

Around 1 in 55 people not in care homes, hospitals or other institutional settings had #COVID19 in the week ending 16 January ow.ly/KL1C50DfoMJ Figure 1: In England, the percentage of people testing posit
In England, London and the North East had the highest infection rates in the week ending 16 January.

We estimate that in London, 1 in 35 people had #COVID19 ow.ly/A0q050DfoP0 Figure 4: London and the North East had the highest percenta
Read 8 tweets
22 Jan
We've published new data from the Opinions and Lifestyle Survey, including questions about feelings towards the #COVID vaccine, mass testing, and the future.

Findings are from 13 to 17 January ow.ly/qDbg50Dfhiu Coronavirus and the social impacts on Great Britain: 22 Janu
There appears to be more positive attitude to the #COVID19 vaccine, with 90% reporting they’d received the vaccine, accepted an offer, or would likely accept if offered ow.ly/hkAn50DfhnG Line chart showing around 9 in 10 adults have now received t
Adults reporting they would be likely to have the #COVID19 vaccine if offered appeared to increase with age, rising from 81% among 16 to 29 year-olds to 98% among those aged 70 years and over ow.ly/JV6450Dfhrw Stacked bar chart showing around 8 in 10 (81%) of adults age
Read 6 tweets
22 Jan
Our latest data show that retail sales increased by an estimated 0.3% in December 2020 ow.ly/LDC950DfcXo Graphic:   Retail sales grew 0.3% in December  Compared with
Commenting on today’s retail sales figures, Deputy National Statistician for Economic Statistics @jathers_ONS said:
(1/4) December’s retail sales increased slightly, driven by an i
.@jathers_ONS continued: (2/4) Food store sales this month were subdued as retailers report
Read 8 tweets

Did Thread Reader help you today?

Support us! We are indie developers!


This site is made by just two indie developers on a laptop doing marketing, support and development! Read more about the story.

Become a Premium Member ($3/month or $30/year) and get exclusive features!

Become Premium

Too expensive? Make a small donation by buying us coffee ($5) or help with server cost ($10)

Donate via Paypal Become our Patreon

Thank you for your support!

Follow Us on Twitter!