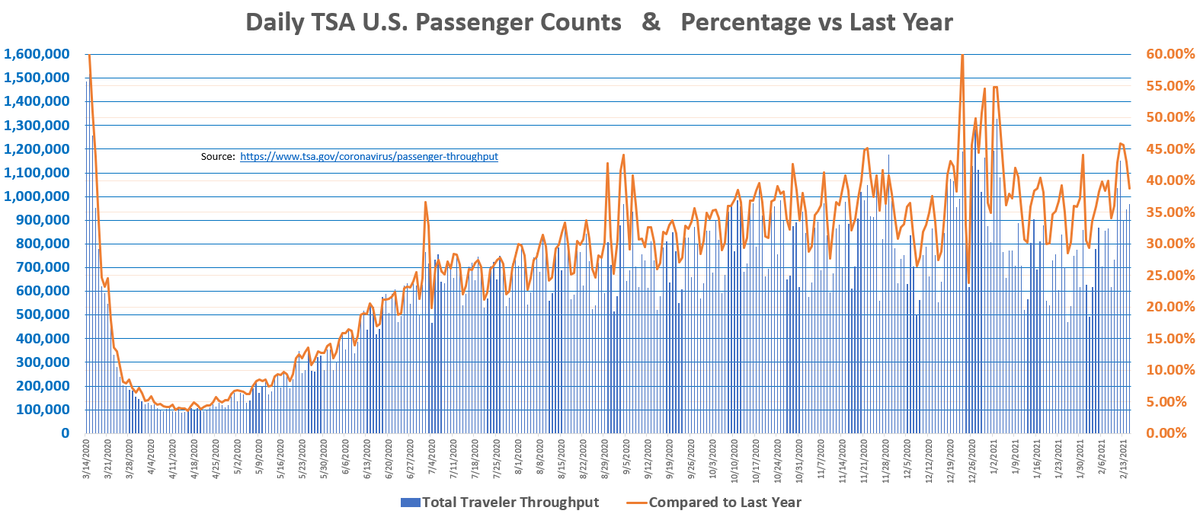
* Air Travel in the US continues to follow along a mostly seasonal pattern, defiantly outperforming the new Covid-19 peak seeing during what used to be Flu Season
* 2021 Traffic thus far mirrors last year, albeit down 60-65%
1/n
* During the height of Covid Season last month, traffic dipped back into the 35% YoY range, but in the past couple of weeks its climbed back to 40%.
* Outside of Christmas, its the strongest YoY since Thanksgiving.
2/n
* 7DMA bottomed out at the end of January at about 665K, but has risen quickly to 900K over the past 2 weeks.
* Buoyed by a President's Day weekend bump in traffic
* Flight search trends are as encouraging as they've been in the last 12 months, will it translate?
3/n
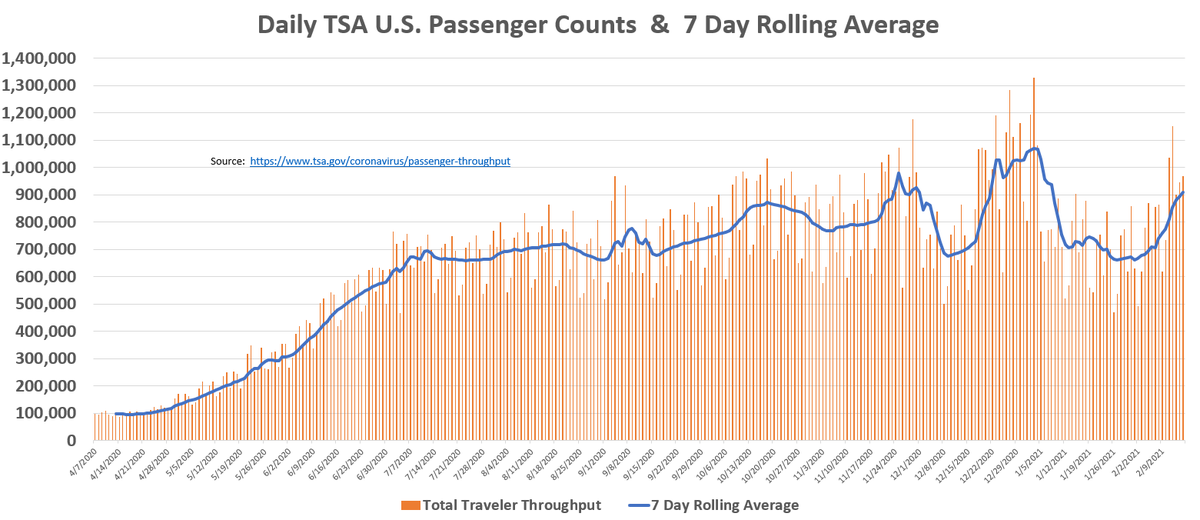
Here is a 70-day moving average chart that smooths out the spikes and also rolls on the same day of the week. Great way to gauge the long term trend.
Will be interesting to see if we see a rapid rise in the upcoming weeks, things appear primed to do so.
4/end
• • •
Missing some Tweet in this thread? You can try to
force a refresh
* exceeding HOF Statistical standards
* being an Ace for 3 WS Champs, including the 1st Red Sox Champ in 86 years
* no hint of PED use
* multiple MLB humanitarian awards
Doesn't make the #HOF in 9 tries because he has the wrong political beliefs
And those HOF statistical metrics I posted...he compares favorably to an Average HALL OF FAMER. Not a borderline between Hall of Very Good and HOF. Not bare minimum HOF. No, he is better in virtually every category compared to the average/median Hall of Famer. Its not close.
Take all the pitchers in the Hall of Fame, and Curt Schilling is better statistically than more than half of those Hall of Famers. He is in the Top Half statistically of all Hall of Famers. And 3 rings. And no PEDs. And upstanding citizen during his career. Its a travesty.
Dick Clark rolling in his grave watching car dealership blow up crazy people balloons, empty streets, Planet Fitness safe zones, and me kissing celebrities when the ball dropped for 2021
Plus I put on the Covid 20 apparently.
Cindy Lauper wearing a face shield on the empty streets of New York, LOL. #2020
.
We now have video footage of unsupervised late night ballot counting in #Georgia, we have statistical evidence of Kim Jong Un-level %s for Biden in the middle of the night, & unheard of vote totals for a D candidate, yet the media will tell you - no evidence of fraud
Summary of statement by POTUS on status of the Election legal fight:
1) Mail-in Ballots 2) Massive change to election rules 3) More registered voters than voting age pop 4) Wisconsin vote dump at 3:42 AM 5) Poll watchers denied accessed
6) Voters forced to file provisional ballots due to duplicate mail-in ballots 7) Dominion Voting systems
7a) documented 6,000 vote switch in MI
7b) 96% of Dominion political donations when to Dems
7c) Texas blocked Dominion from use 8) Red wave in House
2/n
8a) Georgia Senate elections will be watched "like never before" for fraud
8b) Not possible to have these type of coattails, this turnout and lose 9) Michigan Vote dump of 149K going 96% Biden at 6:31am 11/4. 10) Georgia recount meant nothing without checking signatures
3/n
With Georgia fully under the microscope with both the campaign and Sidney Powell lawsuits, and the President headed there next week, I decided to take a look at County level results. See below for earlier GA analysis...
First off what stands out when comparing results to 2016 is the mind boggling over-performance of Biden over Obama & Clinton's numbers.
Biden somehow added 600,000 votes, 33% more than any previous Democrat turnout, in order to overcome huge 2020 turnout for Trump.
2/n
3/end
Here are the Top 38 counties by Increase in Total Raw vote over 2016 (Column O). Trump lost share in every single one despite increasing his Turnout in every one.
Even in big Trump 2016 counties, he lost share despite increasing turnout.
With the below in mind about what "normal" state returns look like, and with the news that a major lawsuit is about to filed in Georgia, let's look at Georgia's returns...
I did a thread on GA early this week, using a spreadsheet & written presentation.
Today I show GA's overall election returns & then zoom in on the day when a 400,000 vote lead for Trump disappeared.
Notice the difference between Georgia and a "normal" state return chart
2/n
This chart shows 3 full days of returns, and how Georgia looks nothing like a "normal" state return.
Big Trump lead in a "normal" return would simply continue till the state is called on election night. But over 3 days, Biden somehow reverses the trend and catches up.