.
We now have video footage of unsupervised late night ballot counting in #Georgia, we have statistical evidence of Kim Jong Un-level %s for Biden in the middle of the night, & unheard of vote totals for a D candidate, yet the media will tell you - no evidence of fraud
Summary of statement by POTUS on status of the Election legal fight:
1) Mail-in Ballots 2) Massive change to election rules 3) More registered voters than voting age pop 4) Wisconsin vote dump at 3:42 AM 5) Poll watchers denied accessed
6) Voters forced to file provisional ballots due to duplicate mail-in ballots 7) Dominion Voting systems
7a) documented 6,000 vote switch in MI
7b) 96% of Dominion political donations when to Dems
7c) Texas blocked Dominion from use 8) Red wave in House
2/n
8a) Georgia Senate elections will be watched "like never before" for fraud
8b) Not possible to have these type of coattails, this turnout and lose 9) Michigan Vote dump of 149K going 96% Biden at 6:31am 11/4. 10) Georgia recount meant nothing without checking signatures
3/n
With Georgia fully under the microscope with both the campaign and Sidney Powell lawsuits, and the President headed there next week, I decided to take a look at County level results. See below for earlier GA analysis...
First off what stands out when comparing results to 2016 is the mind boggling over-performance of Biden over Obama & Clinton's numbers.
Biden somehow added 600,000 votes, 33% more than any previous Democrat turnout, in order to overcome huge 2020 turnout for Trump.
2/n
3/end
Here are the Top 38 counties by Increase in Total Raw vote over 2016 (Column O). Trump lost share in every single one despite increasing his Turnout in every one.
Even in big Trump 2016 counties, he lost share despite increasing turnout.
With the below in mind about what "normal" state returns look like, and with the news that a major lawsuit is about to filed in Georgia, let's look at Georgia's returns...
I did a thread on GA early this week, using a spreadsheet & written presentation.
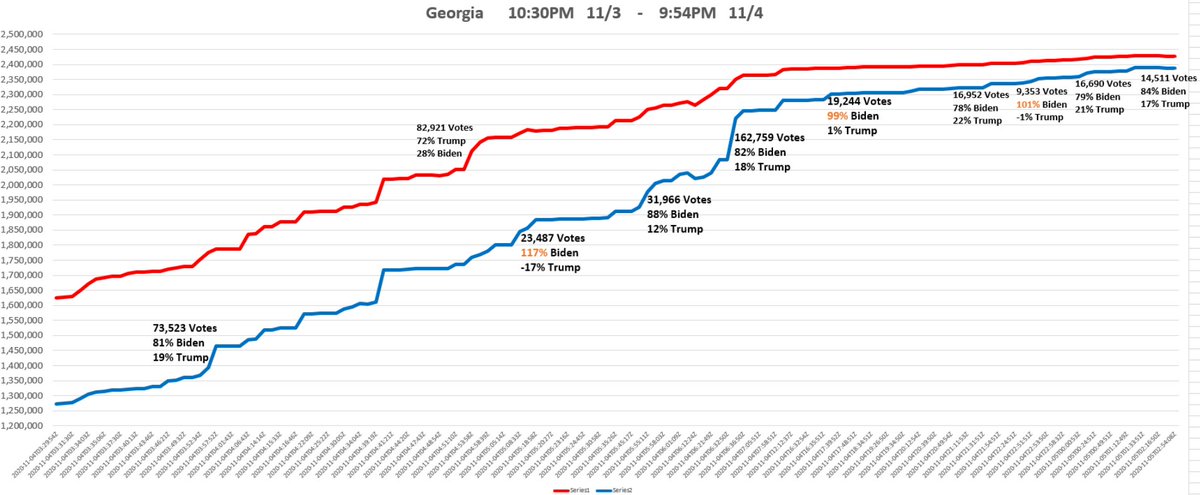
Today I show GA's overall election returns & then zoom in on the day when a 400,000 vote lead for Trump disappeared.
Notice the difference between Georgia and a "normal" state return chart
2/n
This chart shows 3 full days of returns, and how Georgia looks nothing like a "normal" state return.
Big Trump lead in a "normal" return would simply continue till the state is called on election night. But over 3 days, Biden somehow reverses the trend and catches up.
What do "normal" state Presidential returns look like?
THREAD 1/n
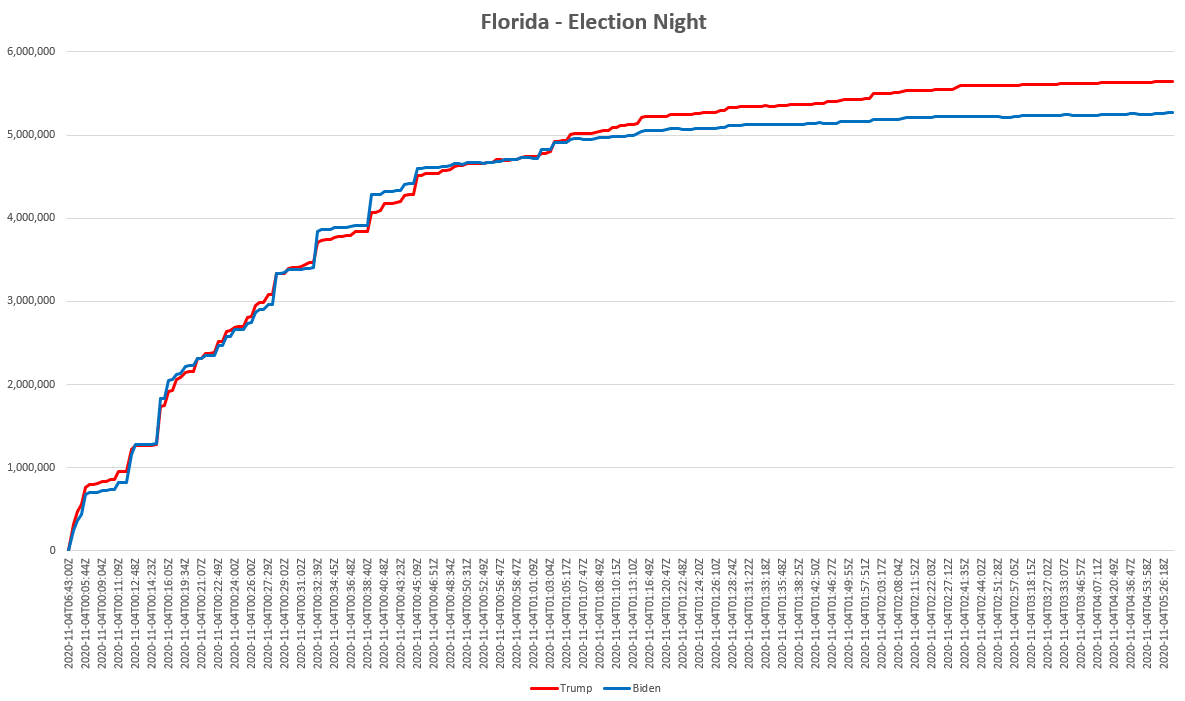
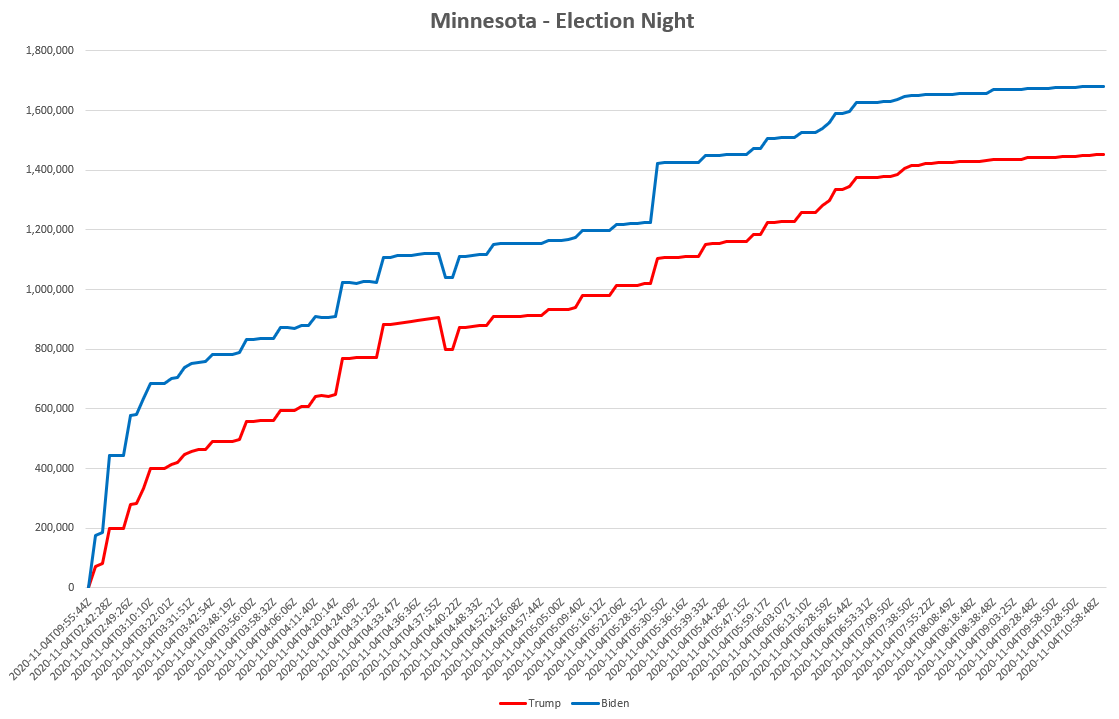
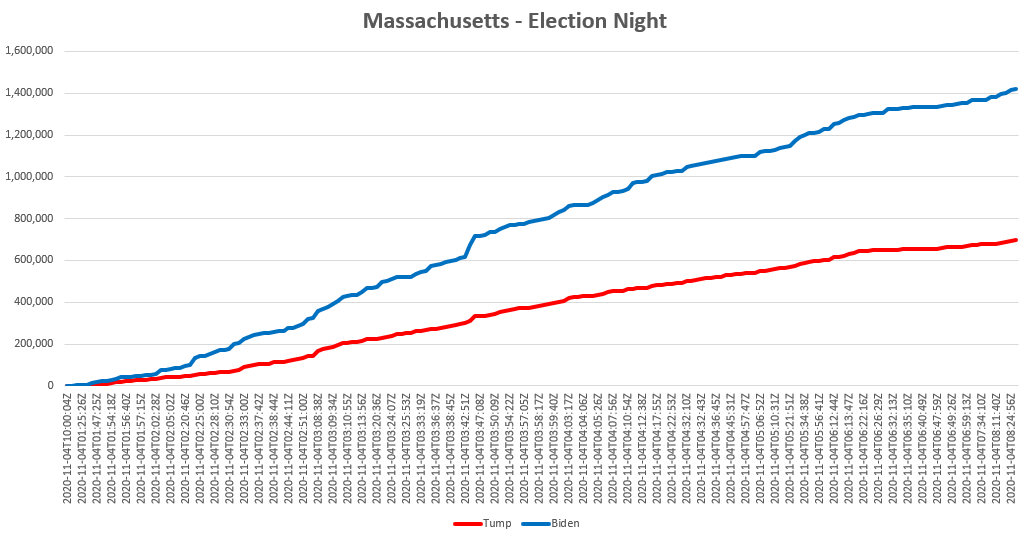
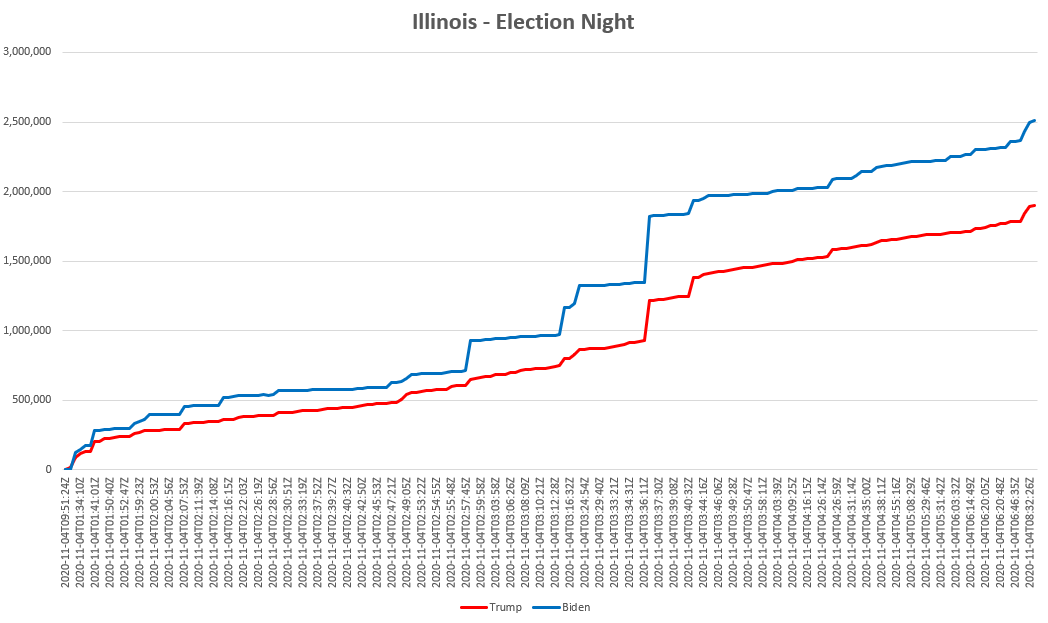
Many have asked about other states & what their curves look like. Here are 4 states, 2 of which for sure did mail-in voting - FL, MN, MA, IL. I could do 10 more, they are all the same.
Here we go...
1/n
2/n
Let's look at two fairly close races, FL and MN. FL did mail-in. These are the curves from election night into the early AM.
Mail-in ballots are counted all day. Computers are counting the election day voters. So, this notion of "waiting" to count mail-in is nonsense.
3/n
Here are two other states Biden won easily. MA and IL. MA does mail in. The ratios of incoming vote stay relatively consistent, mail in or not. Yes there are some 70-30 type batches in there, but in a close election, its consistent.
Similar to the Pennsylvania analysis I did this morning using the New York Times Decision Desk JSON.
CLICK THE IMAGES in each tweet, starting with below. Michigan's issue was different than PA, so I start in reverse...
1/n
2/n
Here is the full report.
I didn't see the same discrepancies and vote reductions that I saw in PA. Michigan came down to 6 large dumps of actual ballots run through the front end of the system on 11/4 and 11/5, 361K of them, that went 90%+ for Biden.
2/n
3/n
Here are the 6 ballot dumps in Green, across 3 screen shots. Red/Blue is the variance & vote total work, similar to PA, which turned up little either way.
The 6 ballot dumps won MI for Biden, and 90%+ on 361K ballots is virtually a statistical impossibility
I have downloaded and saved the New York Times Decision Desk JSONs for 8 states. Used a tool to convert to CSV.
Next few slides will break down what I found. CLICK THE IMAGES in each tweet, starting with below
1/n
. 2/n
Pennsylvania's data, especially early in the night, is a total mess. But it smooths out about 9:30pm. After that Biden's impacts occur mostly during EN. After 2am, it all goes heavy one way against Trump.
2/n
Here's 2 screen shots of the spreadsheet I built using the converted JSON to CSV.
* One from 11/3 including the 66,388% variance instance that ended up on CNN.
* The second, from 11/5, littered with both variances and outright vote reductions all going Biden's way.