With the below in mind about what "normal" state returns look like, and with the news that a major lawsuit is about to filed in Georgia, let's look at Georgia's returns...

THREAD 1/n
I did a thread on GA early this week, using a spreadsheet & written presentation.

Today I show GA's overall election returns & then zoom in on the day when a 400,000 vote lead for Trump disappeared.

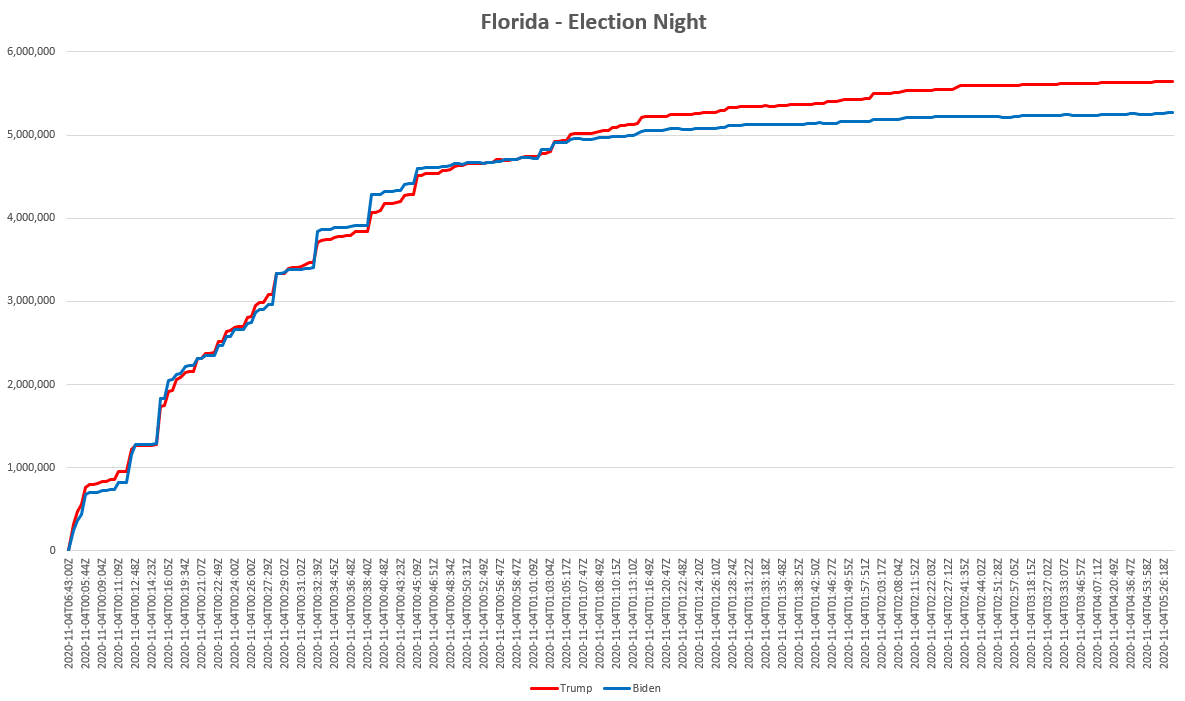
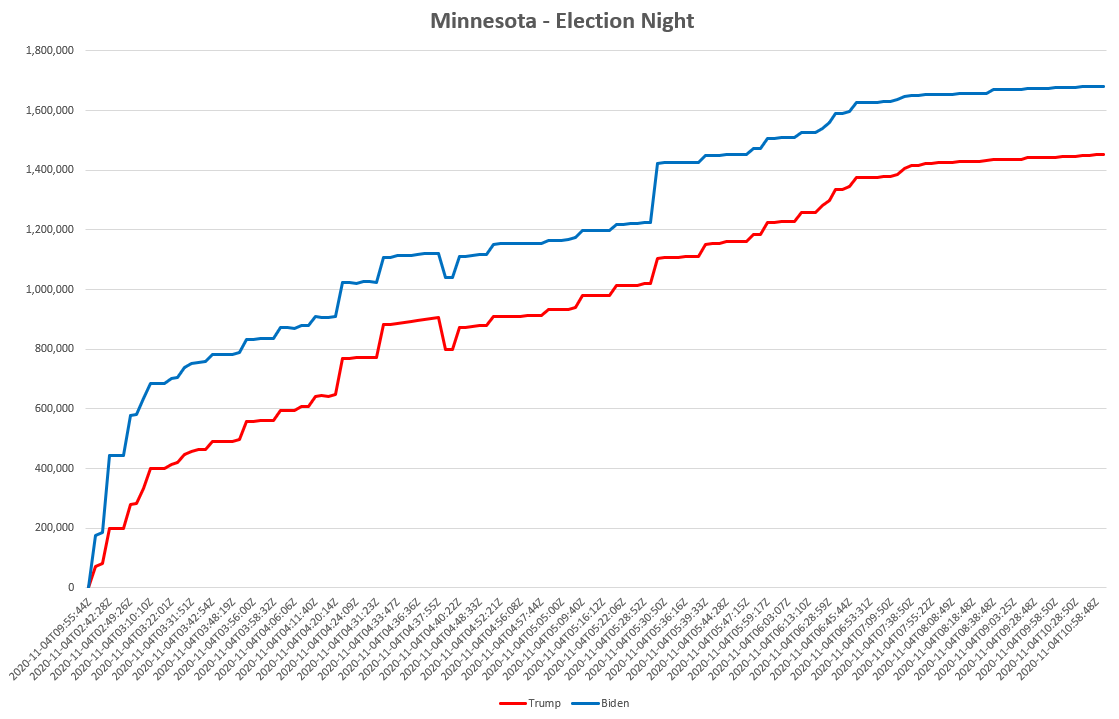
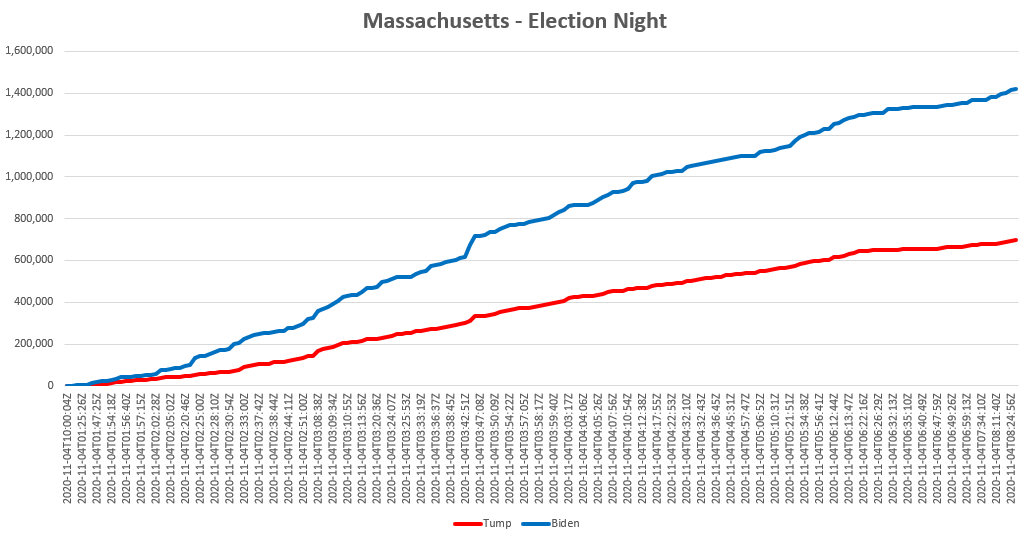
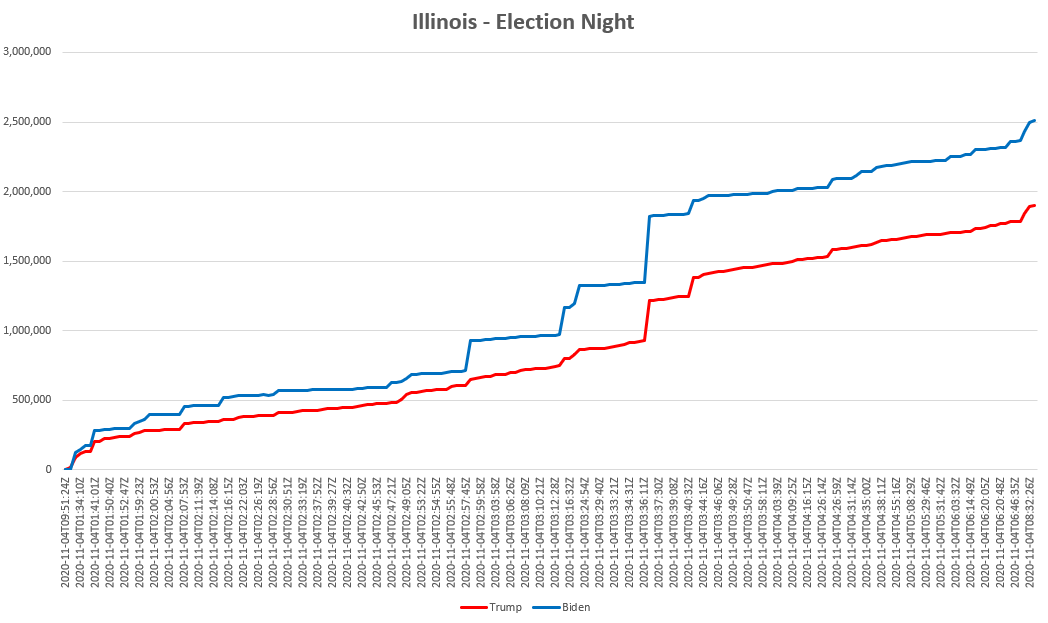
Notice the difference between Georgia and a "normal" state return chart

2/n
This chart shows 3 full days of returns, and how Georgia looks nothing like a "normal" state return.

Big Trump lead in a "normal" return would simply continue till the state is called on election night. But over 3 days, Biden somehow reverses the trend and catches up.

3/n
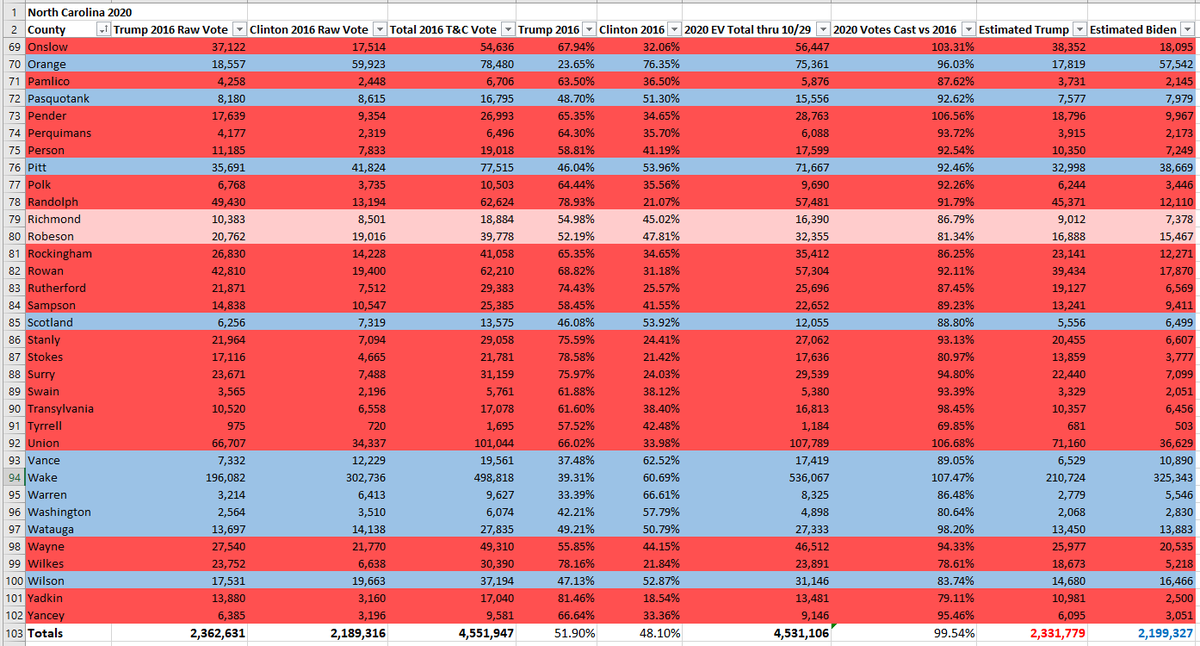
And here is the 24 hours beginning late on election night where Trump's lead mostly evaporated. Took another full day for Biden to catch up after this, but by the end of this chart, its neck and neck.

Look at the ratios required to make this happen. 100%+ in some cases

4/n
Here is the link to the New York Times Georgia JSON file. I converted it CSV and built some charts.

All confirmable if you are interested.

static01.nyt.com/elections-asse…

5/end

• • •

Missing some Tweet in this thread? You can try to force a refresh
 

Keep Current with therealarod1984

therealarod1984 Profile picture

Stay in touch and get notified when new unrolls are available from this author!

Read all threads

This Thread may be Removed Anytime!

PDF

Twitter may remove this content at anytime! Save it as PDF for later use!

Try unrolling a thread yourself!

how to unroll video
  1. Follow @ThreadReaderApp to mention us!

  2. From a Twitter thread mention us with a keyword "unroll"
@threadreaderapp unroll

Practice here first or read more on our help page!

More from @therealarod1984

22 Nov
What do "normal" state Presidential returns look like?

THREAD 1/n

Many have asked about other states & what their curves look like. Here are 4 states, 2 of which for sure did mail-in voting - FL, MN, MA, IL. I could do 10 more, they are all the same.

Here we go...

1/n
2/n
Let's look at two fairly close races, FL and MN. FL did mail-in. These are the curves from election night into the early AM.

Mail-in ballots are counted all day. Computers are counting the election day voters. So, this notion of "waiting" to count mail-in is nonsense.
3/n

Here are two other states Biden won easily. MA and IL. MA does mail in. The ratios of incoming vote stay relatively consistent, mail in or not. Yes there are some 70-30 type batches in there, but in a close election, its consistent.
Read 7 tweets
16 Nov
Michigan Vote Database analysis - THREAD

1/n

Similar to the Pennsylvania analysis I did this morning using the New York Times Decision Desk JSON.

CLICK THE IMAGES in each tweet, starting with below. Michigan's issue was different than PA, so I start in reverse...

1/n
2/n

Here is the full report.

I didn't see the same discrepancies and vote reductions that I saw in PA. Michigan came down to 6 large dumps of actual ballots run through the front end of the system on 11/4 and 11/5, 361K of them, that went 90%+ for Biden.

2/n
3/n

Here are the 6 ballot dumps in Green, across 3 screen shots. Red/Blue is the variance & vote total work, similar to PA, which turned up little either way.

The 6 ballot dumps won MI for Biden, and 90%+ on 361K ballots is virtually a statistical impossibility

3/n
Read 4 tweets
16 Nov
.
Pennsylvania Vote Database analysis - THREAD

1/n

I have downloaded and saved the New York Times Decision Desk JSONs for 8 states. Used a tool to convert to CSV.

Next few slides will break down what I found. CLICK THE IMAGES in each tweet, starting with below

1/n
.
2/n

Pennsylvania's data, especially early in the night, is a total mess. But it smooths out about 9:30pm. After that Biden's impacts occur mostly during EN. After 2am, it all goes heavy one way against Trump.

2/n
Here's 2 screen shots of the spreadsheet I built using the converted JSON to CSV.

* One from 11/3 including the 66,388% variance instance that ended up on CNN.
* The second, from 11/5, littered with both variances and outright vote reductions all going Biden's way.

3/n
Read 5 tweets
5 Nov
1/n

I'll just keep repeating - Unless there's a hand recount & voter registration confirmation in the 7 states in question, this nation will be in chaos whoever the next President is.

Its not a numbers game anymore..

Thread - 1/n
2/n

These 7 states have been counting ballots for 54 hours. The entire process is completely tainted. An insufficient numbers of American trust the process

Any "results" and number crunching occurring against any of these ballots is pointless.

2/n
3/end

2000 was resolved by hand recount in FL. Voter reg confirmation needs to be included in 2020. It will take weeks to do this - Fine.

Otherwise the next President will lead a Banana Republic w half the nation in open revolt.

It's too late for Tuesday ballot counting
Read 4 tweets
4 Nov
As someone who has been trying in my own way to push back the darkness in regards to how our media and public health officials have used a pandemic to seize power and control...

What I witnessed last night in regards to our election was openly and brazenly evil

1/n
While I am not shocked, I am discouraged that it appears the deep state, media and public officials will disregard any sense of decency, in any domain, to win power and control over all of our lives.

The entire night was example after example, and its continued overnight

2/n
The media refusing to call any state for Trump unless it was "100% sure," while calling any state for Biden the second the polls closed. No attempt to avoid the appearance of impropriety. VA, AZ called early, while every Trump battleground called super late or not at all.

3/n
Read 7 tweets
2 Nov
North Carolina Early Vote (EV) - Full Analysis of Early Vote

THREAD 1/N

Methodology
* Take all EV per county through 10/30
* Multiply 2016 T or C %

Estimated EV estimate
* Trump 51.4 to Biden 48.6%
* Trump is up 132K votes
* Targetearly.Targetsmart.com = B 47.2% to T 46.2%

1/n Image
2/n

* 99.54% of the turnout vs. 2016
* Dark Red = Counties Trump win > 10%+ in 2016
* Pink = Trump win 0% < > 10%
* Blue = Clinton win any margin

Next we look at
* Sorted by most EV % over 2016, most raw 2020 EV total
* 2016 Clinton, Trump, Battleground Counties

2/n
3/n

If you sort the table by Biggest % increase over 2016 vote, the Top 38 counties shown are:

9 Clinton Counties
2 Battleground counties
27 Trump Counties

Biden with a small leads in estimated EV 1,566,018 to 1,507,529. 59K lead

3/n Image
Read 6 tweets

Did Thread Reader help you today?

Support us! We are indie developers!


This site is made by just two indie developers on a laptop doing marketing, support and development! Read more about the story.

Become a Premium Member ($3/month or $30/year) and get exclusive features!

Become Premium

Too expensive? Make a small donation by buying us coffee ($5) or help with server cost ($10)

Donate via Paypal Become our Patreon

Thank you for your support!

Follow Us on Twitter!