The CMI has now published it's latest weekly analysis of COVID excess mortality on an age-standardised basis. It now estimates 104,600 excess deaths, with 42% in the second wave.

A few more observations follow below.

1/4
We can see how there has already been around 4% (of a full year's deaths) excess so far in 2021.

This graph, which compares a year with the previous one, will abruptly change direction in late March as 2020 worsened, but for now it helps show the quantum of variance.

2/4
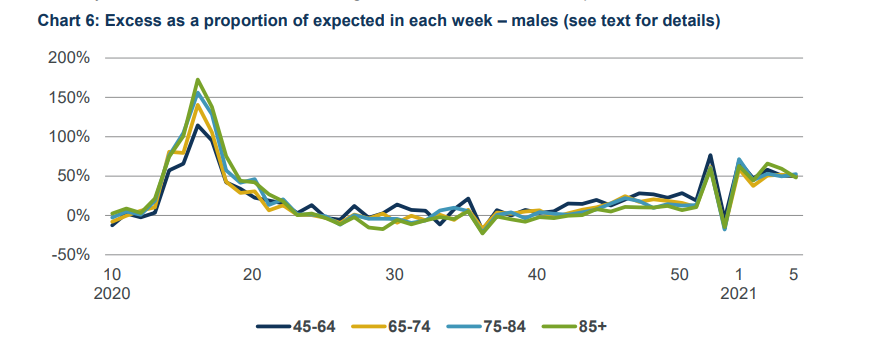
We can see here that male mortality in all age groups over 45 has been around 50% higher than normal in recent weeks. COVID doesn't just affect the elderly or very sick.

3/4
With around 4% excess mortality to add to the 13.4% we experienced in 2020 (from late March to the end of the year), we have now had around 17.5% excess mortality, in relation to a full year's expectation, in just over 10 months.

4/4 END

• • •

Missing some Tweet in this thread? You can try to force a refresh
 

Keep Current with John Roberts

John Roberts Profile picture

Stay in touch and get notified when new unrolls are available from this author!

Read all threads

This Thread may be Removed Anytime!

PDF

Twitter may remove this content at anytime! Save it as PDF for later use!

Try unrolling a thread yourself!

how to unroll video
  1. Follow @ThreadReaderApp to mention us!

  2. From a Twitter thread mention us with a keyword "unroll"
@threadreaderapp unroll

Practice here first or read more on our help page!

More from @john_actuary

16 Feb
As reported on Saturday, the proportion of England hospital deaths over 80 has fallen below 50%, and the general trend is still clearly downwards, with some recent days around 46%.

Next I'll set out what that might mean, in terms of influencing the overall death figures.

1/4
If the prop'n falls from 56% to 50%, and there's no change for younger ages, then out of 100 deaths (split 56/44), it's now split 44/44. So that's a reduction of 21% in the over 80 deaths, and 12% overall.

(I've used 56% as that was the average before the mid Dec spike.)

2/4
This is broadly in line (maybe 3 or 4 days behind) with the expectation laid out in the paper recently published with @doctimcook.


So I think it is very clear now that we are seeing the vaccine effect in death figures.

3/4
Read 4 tweets
16 Feb
The latest @ONS antibody survey is out today, and shows a big jump in the % of over 80s with antibodies in England, though less so elsewhere.

In England, the overall total has risen from 15.3% two weeks ago to 18.5%, across the latest 28 day period.

A short thread.
1/5
The Over 80 level has soared from 25.7% to 40.9% in England, due to vaccinations. The other countries are, maybe surprisingly, well behind though.

Note this is an average over 4 weeks to Feb 1st, and the period for immunity to kick in needs to be taken into consideration.

2/5
By region, London continues to be the highest, rising from 21.0 to 24.8%. This is likely to be due to the high level of infections there, rather than any vaccine related effect.

3/5
Read 5 tweets
13 Feb
Sat vaccine update: Nearly there!

545k first doses reported today (+10% from last week), bringing the total to 14.56m, or 99.7% of the estimated number in PG's 1 to 4.

The weekly rate is now 3.1m.

Next, Scotland, and some interpretation on what I mean by "nearly there".
1/4. Image
Bear in mind that the population figures (including CH's) are estimates, but the Scottish figures for over 75s and CHs do look very impressive.

A little more to do with the 70-74's, but there are three more days to jab around 80k in that group.

2/4 Image
Will reaching 14.6m mean everyone in PG's 1-4 has been jabbed who wants to be?

Unlikely. Some of those will already be for those under 70 in the next groups, and there will inevitably be some "loose ends" - eg housebound visits to finish. And the 14.6m was just an estimate.
3/4
Read 4 tweets
13 Feb
The latest England hospital data reveals that the 7 day moving average of the proportion of deaths has today moved below 50%, at 49.7%. The rate of fall appears very slightly faster since around 28th Jan.

Prior to a spike in Dec, the proportion was very stable at 56%.

1/3
The absolute daily figures are of course falling much more rapidly, in line with the falls in prevalence of the virus. It's halved in around 3 weeks, and although the latest days will still have unreported deaths, the trend appears to be continuing.

2/3
With reported deaths being much lower on Sun & Mon, I'll update again on Tuesday. Let's hope we see a continuation of the trend then!

3/3
Read 4 tweets
13 Feb
The latest @ICNARC report on intensive care activity on behalf of @COVID19actuary, starting with the clearest evidence possible that this has not been "just another flu winter", even with non-COVID activity down.

Patient numbers have been close to double last Jan.

1/15
Unlike April, this peak has come after a sustained period of increased activity throughout the Autumn too, with the cumulative number of patients now exactly double that admitted in the first wave. This can be seen in the occupancy stats next too.

2/15
It's really worth emphasising that although the peak has passed in terms of admissions, the overall numbers in ICU are still exceptionally high, and remain at first wave peak levels.

Note also that this second wave timeline is now as long as the first.

3/15
Read 15 tweets
12 Feb
Good news all round in this week's ONS infectivity survey. All four nations are showing falls averaging around 20%.

Starting with England, the modelled level has fallen from 1.55% to 1.28%, or just under 700k people (1 in 80).

Wales falls from 1.40% to 1.16% (1 in 80)

1/6
Northern Ireland falls from 1.56% to 1.33% (1 in 75), whilst Scotland, which has been the most stable of the four nations, falls from 0.88% to 0.67% (1 in 150).

2/6
Regionally in England, London is continuing to fall fastest. Most areas continue to fall, with the SE now the lowest region - a contrast with a few weeks ago.

The direction in the SW is less clear however.

3/6
Read 6 tweets

Did Thread Reader help you today?

Support us! We are indie developers!


This site is made by just two indie developers on a laptop doing marketing, support and development! Read more about the story.

Become a Premium Member ($3/month or $30/year) and get exclusive features!

Become Premium

Too expensive? Make a small donation by buying us coffee ($5) or help with server cost ($10)

Donate via Paypal Become our Patreon

Thank you for your support!

Follow Us on Twitter!