The latest @ICNARC report on intensive care activity on behalf of @COVID19actuary, starting with the clearest evidence possible that this has not been "just another flu winter", even with non-COVID activity down.

Patient numbers have been close to double last Jan.

1/15
Unlike April, this peak has come after a sustained period of increased activity throughout the Autumn too, with the cumulative number of patients now exactly double that admitted in the first wave. This can be seen in the occupancy stats next too.

2/15
It's really worth emphasising that although the peak has passed in terms of admissions, the overall numbers in ICU are still exceptionally high, and remain at first wave peak levels.

Note also that this second wave timeline is now as long as the first.

3/15
With daily case numbers falling rapidly it's of note that there were still over 2000 ICU admissions in the last fortnight. Even with lower prevalence in the community and vaccinations, we expect units to continue to be busy for some time yet.

4/15
The age distribution here gives a clue why. Only a small proportion of admissions are in relation to the age groups vaccinated so far. It's only now we are starting to get into the under 70 groups that, in due course, there will begin to be a meaningful effect on numbers.

5/15
Just the flu or pneumonia? Hardly. Admissions in Jan have been between 5 and 6 times normal pneumonia levels, so even allowing for the drop off in those, this can't just be a case of misattribution or replacement of one illness by another.

Flu next.

6/15
Note the flu scale is ten times smaller, so these numbers wouldn't really be material in comparison to the previous graph in any event. There's little or no flu this year, as is well understood, but even the exceptional peak of 600 in Jan 19 is only 6% of COVID admissions.
7/15
It's concerning that we are seeing significantly lower levels of heart related admissions again, along with slightly lower admissions for strokes.

Is this to do with lower activity in lockdown reducing actual cases, or that they are not being presented for some reason?

8/15
Similarly for trauma and self harm. It's certainly possible that there are fewer serious accidents due to lower activity. On self harm, there continues to be no evidence in this data that there has been an increase during lockdowns.

9/15
We continue to see the stark disparity in the level of admissions for the most deprived. This is likely to be reflective of many factors, relating to cramped living conditions, employment and ethnicity, all of which are linked.

10/15
Another indication of the pressure that units have been under is the increasing number of transfers, with London, maybe not surprisingly seeing the greatest numbers.

11/15
So far in the second wave, in broad numbers around a third of the 21,859 patients have been completely discharged, a third have died, and a third are still either in ICU or acute hospital. Hopefully those now transferred to acute hospital beds are now recovering.

12/15
Next 28 and 90 day survival curves, which after looking favourable in comparison to the first wave a couple of months ago are now broadly similar, with over 40% of patients not having a favourable outcome.

13/15
By age though, there are slight improvements at some ages and more significant ones for the 50-59 and 70+ age groups. That suggests the older average age of patients (around 2 years) balances out improvements in care to give the overall similar outcome we've just seen.

14/15
With over 100 pages there is much more information than summarised here.

icnarc.org/Our-Audit/Audi…

Sincere thanks to all intensivists and indeed all health service staff for their continuing and sustained exceptional efforts to save lives during the pandemic.

15/15 END

• • •

Missing some Tweet in this thread? You can try to force a refresh
 

Keep Current with John Roberts

John Roberts Profile picture

Stay in touch and get notified when new unrolls are available from this author!

Read all threads

This Thread may be Removed Anytime!

PDF

Twitter may remove this content at anytime! Save it as PDF for later use!

Try unrolling a thread yourself!

how to unroll video
  1. Follow @ThreadReaderApp to mention us!

  2. From a Twitter thread mention us with a keyword "unroll"
@threadreaderapp unroll

Practice here first or read more on our help page!

More from @john_actuary

13 Feb
The latest England hospital data reveals that the 7 day moving average of the proportion of deaths has today moved below 50%, at 49.7%. The rate of fall appears very slightly faster since around 28th Jan.

Prior to a spike in Dec, the proportion was very stable at 56%.

1/3
The absolute daily figures are of course falling much more rapidly, in line with the falls in prevalence of the virus. It's halved in around 3 weeks, and although the latest days will still have unreported deaths, the trend appears to be continuing.

2/3
With reported deaths being much lower on Sun & Mon, I'll update again on Tuesday. Let's hope we see a continuation of the trend then!

3/3
Read 4 tweets
12 Feb
Good news all round in this week's ONS infectivity survey. All four nations are showing falls averaging around 20%.

Starting with England, the modelled level has fallen from 1.55% to 1.28%, or just under 700k people (1 in 80).

Wales falls from 1.40% to 1.16% (1 in 80)

1/6
Northern Ireland falls from 1.56% to 1.33% (1 in 75), whilst Scotland, which has been the most stable of the four nations, falls from 0.88% to 0.67% (1 in 150).

2/6
Regionally in England, London is continuing to fall fastest. Most areas continue to fall, with the SE now the lowest region - a contrast with a few weeks ago.

The direction in the SW is less clear however.

3/6
Read 6 tweets
10 Feb
Wed vaccine update:

412k first doses today (+10% on last Wed), with the total now 13.06m.

We continue to track at a steady 3.0m a week, and have just 1.54m to achieve the 14.6m that the VDP suggests is needed to complete PG's 1-4.

Some demographic insight next.

1/4 Image
Thanks to openSAFELY we have some good insight on ethnicity take-up. Unfortunately it confirms that it is worryingly lower in BAME communities, particularly the over 80s.

Data is to Feb 4th.

2/4

opensafely.org/covid19-vaccin… Image
There appears a slightly narrower spread in the 70-79 age group, although this is further away from completion yet. Given BAME groups have been hit hardest by COVID, this data is doubly concerning, although is unlikely to come as a surprise.
3/4 Image
Read 4 tweets
13 Jan
The VDP has 14.6 people in categories 1 to 4 for the UK. With the gov't expressing confidence that the target to vaccinate them by Feb 15th can be achieved, let's start to check progress. (Yesterday's daily figure included for context.) We need an average of c350k per day. 1/5
The current shortfall shouldn't be too concerning, (yet). We know that the programme is ramping up, but every day we fall behind will mean having to go above the starting average later on to catch up. The maths is a bit like limited overs cricket, but much more serious. 2/5
I've deliberately ignored the recent switch from "vaccinated" to "offered a vaccine". We know some will decline (hopefully not many), but the apparent sleight of hand in posting out test kits to meet a testing target is not easily forgotten. 3/5
Read 5 tweets
12 Jan
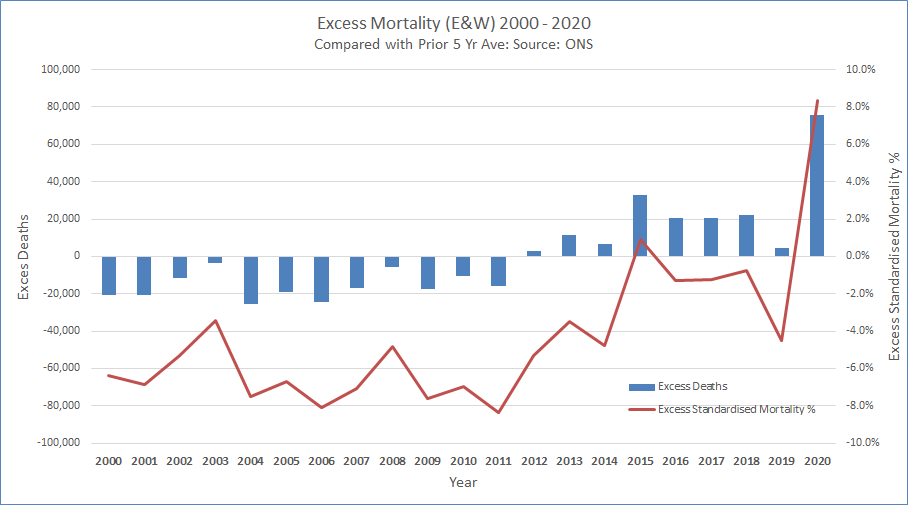
The @ONS has published an updated mortality series, with deaths and standardised mortality, now including 2020. Using the prior 5 year average, we can calculate excess deaths and mortality over recent years. 2020 is exceptionally bad on either measure. A short thread. 1/5
Standardised mortality is the best measure, as it adjusts for population size and an ageing population. At +8.3% it compares badly with the previous average of -5.0% this century. Only one other year, 2015, was slightly positive (+0.9%), with an exceptionally bad flu year. 2/5
Excess deaths were negative in the first decade. As improvements in mortality then slowed, the effect of the ageing population has outweighed the lower level of improvement. Hence why we've recently seen more deaths, (and why excess deaths alone is an imperfect measure.) 3/5
Read 5 tweets
8 Jan
The latest update from @ICNARC on COVID intensive care activity has been published, summarised here on behalf of @COVID19Actuary. We've now passed a sobering milestone with more admissions (12,115) in the second wave than the first (10,935), with 2,938 in the last 14 days. 1/18
Here's the recent geographical split, and the emphasis on London and surrounding regions is as clear as it is not surprising. Only the East and London have yet to pass their first wave total, and at current rates, they will do so in the next few days. This data is to 7 Jan. 2/18
The recent upsurge is very clear here, after a slight dip following the November lockdown. Whilst the early phase of the second wave was much less severe than in March, the recent increase is not dissimilar, and from a base of a much higher level of activity. 3/18
Read 18 tweets

Did Thread Reader help you today?

Support us! We are indie developers!


This site is made by just two indie developers on a laptop doing marketing, support and development! Read more about the story.

Become a Premium Member ($3/month or $30/year) and get exclusive features!

Become Premium

Too expensive? Make a small donation by buying us coffee ($5) or help with server cost ($10)

Donate via Paypal Become our Patreon

Thank you for your support!

Follow Us on Twitter!