💉VACCINE DATA UPDATE (Feb. 16)💉
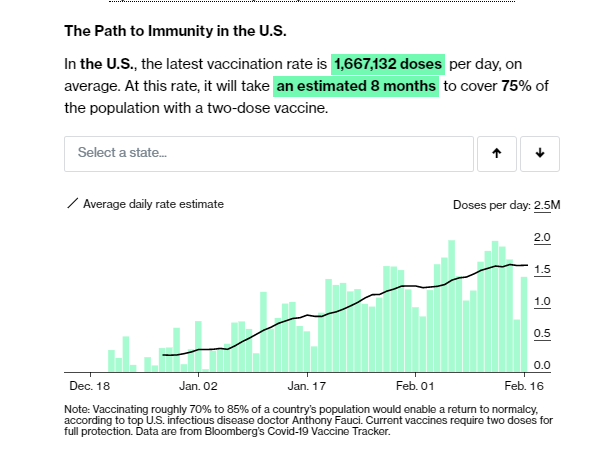
📈1.5M doses today; 7-day avg=1.67M/day
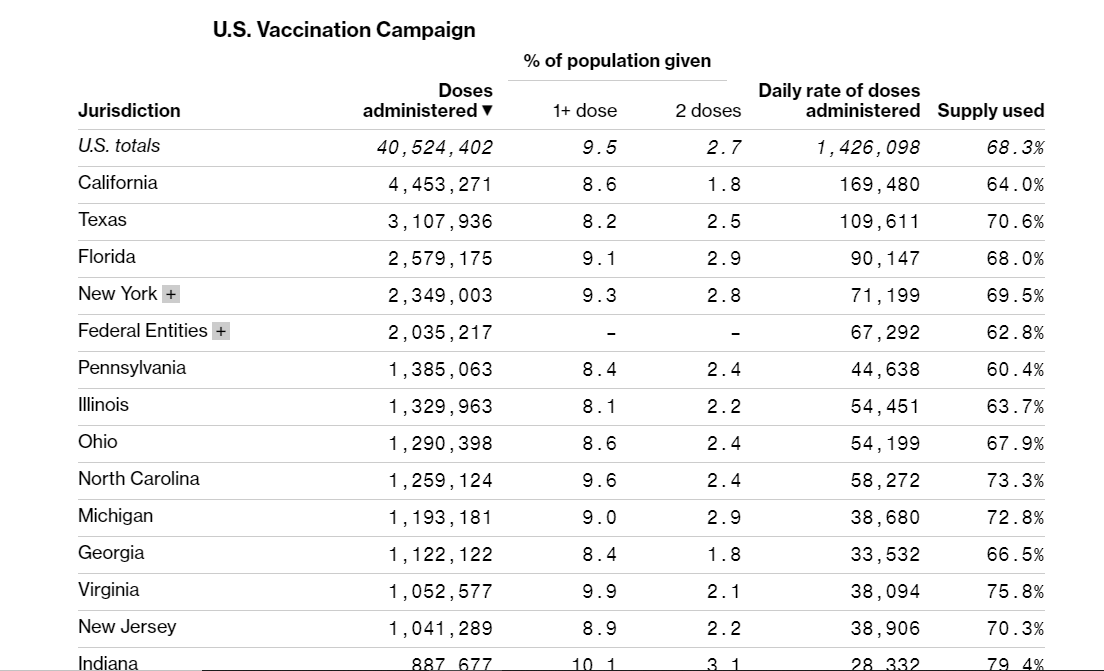
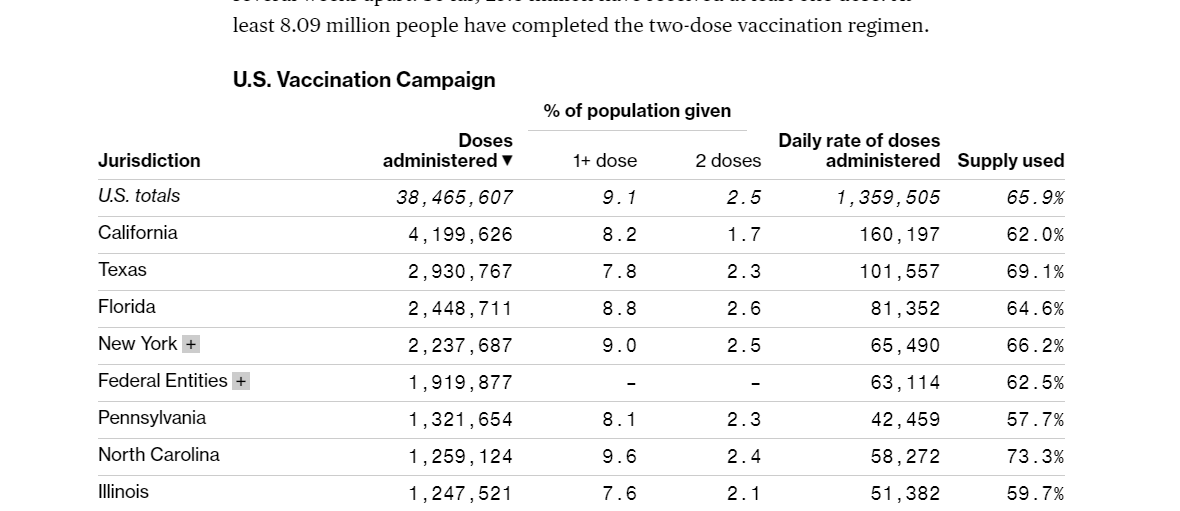
🇺🇸US: 56.1M doses total
👪40.2M people w/ at least 1 dose, 15.6M completed vaccination
❄️Cold in Texas/elsewhere likely pushed daily rate down
⚠️CDC updated today after not yday
bloomberg.com/graphics/covid…
📈1.5M doses today; 7-day avg=1.67M/day
🇺🇸US: 56.1M doses total
👪40.2M people w/ at least 1 dose, 15.6M completed vaccination
❄️Cold in Texas/elsewhere likely pushed daily rate down
⚠️CDC updated today after not yday
bloomberg.com/graphics/covid…
New cases in the U.S. continue to fall after the holiday surge. This chart plots total vaccinations vs confirmed cases. More vaccine = more impact on driving down new cases. The leveling off there is (probably mostly) from post-holiday decline.
bloomberg.com/news/articles/…
bloomberg.com/news/articles/…

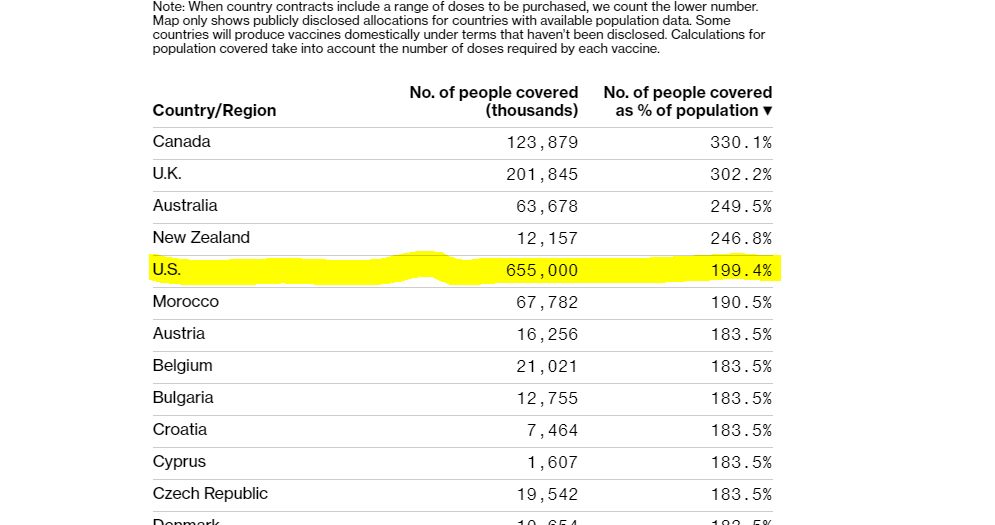
Our full graphic and data, including our international maps and graphics, are available here.
bloomberg.com/graphics/covid…
bloomberg.com/graphics/covid…
More notes on the storms, here: bloomberg.com/news/articles/…
• • •
Missing some Tweet in this thread? You can try to
force a refresh