💉Along with how many vaccines are getting administered, a major question is WHO is getting vaccinated.

Today our team launched a demographics vertical, looking at vaccine breakdowns by race/ethnicity in various states. It's awesome--check it out

bloomberg.com/graphics/covid…
You can see how various groups are getting vaccinated vs their populations. Black and Hispanic populations are being vaccinated below their population shares, while some groups are getting vaccinated above.

bloomberg.com/graphics/covid…
Because many states don't report the data, on don't have great data completeness, we've integrated state-by-state data quality rankings -- you can explore them here:
bloomberg.com/graphics/covid…
You can also look at how vaccine equity stacks up by state -- these charts show if one group or another in a state is getting vaccinated at higher rate. (Even bars = even vaccination):

bloomberg.com/graphics/covid…
Check out the full graphic here:

bloomberg.com/graphics/covid…
And a HUGE congrats to @rzgreenfield @andretartar @angelicalavito @mariepastora @gardnerakayla @rachaeldottle and the rest of the crew who made this amazing work happen!

• • •

Missing some Tweet in this thread? You can try to force a refresh
 

Keep Current with Drew Armstrong

Drew Armstrong Profile picture

Stay in touch and get notified when new unrolls are available from this author!

Read all threads

This Thread may be Removed Anytime!

PDF

Twitter may remove this content at anytime! Save it as PDF for later use!

Try unrolling a thread yourself!

how to unroll video
  1. Follow @ThreadReaderApp to mention us!

  2. From a Twitter thread mention us with a keyword "unroll"
@threadreaderapp unroll

Practice here first or read more on our help page!

More from @ArmstrongDrew

16 Feb
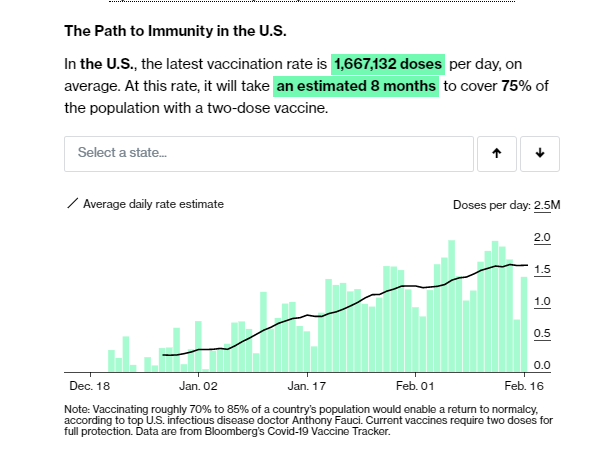
💉VACCINE DATA UPDATE (Feb. 16)💉

📈1.5M doses today; 7-day avg=1.67M/day
🇺🇸US: 56.1M doses total
👪40.2M people w/ at least 1 dose, 15.6M completed vaccination

❄️Cold in Texas/elsewhere likely pushed daily rate down
⚠️CDC updated today after not yday

bloomberg.com/graphics/covid…
New cases in the U.S. continue to fall after the holiday surge. This chart plots total vaccinations vs confirmed cases. More vaccine = more impact on driving down new cases. The leveling off there is (probably mostly) from post-holiday decline.

bloomberg.com/news/articles/…
Our full graphic and data, including our international maps and graphics, are available here.

bloomberg.com/graphics/covid…
Read 4 tweets
11 Feb
💉VACCINE DATA UPDATE (Feb 11)💉

🚀Big number day
🧵See thread link below about vaccine deals for 200M doses; good news on supply

📈2M doses today; 7-day avg=1.62M/day
🇺🇸US: 48M doses total
🧑‍🤝‍🧑35.7M people w/ at least 1 dose,🏅11.9M completed vaccination

bloomberg.com/graphics/covid…
200 million more doses coming to the U.S. -- these deals are a big deal

Read 5 tweets
11 Feb
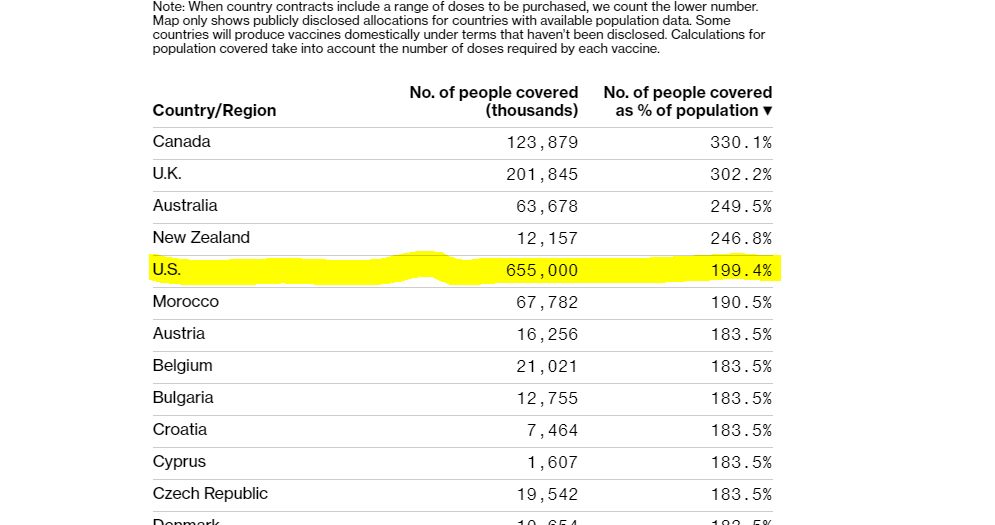
💉The U.S. has just announced deals for 200M more vaccine doses (100M Pfizer, 100M Moderna) for delivery by end of July.

🚀The U.S. has now climbed our ranking of vaccine deals, with more vaccine per capita arranged for than all but four other countries

bloomberg.com/news/articles/…
Here's our table of vaccine deals -- the U.S. now has a TON of vaccine inbound. It's also received more vaccine faster than many other countries with deals for cleared vaccines -- Canada got briefly cut off, more or less, amid a supply interruption

bloomberg.com/news/articles/…
Read 4 tweets
6 Feb
💉VACCINE DATA UPDATE (Feb. 6)💉

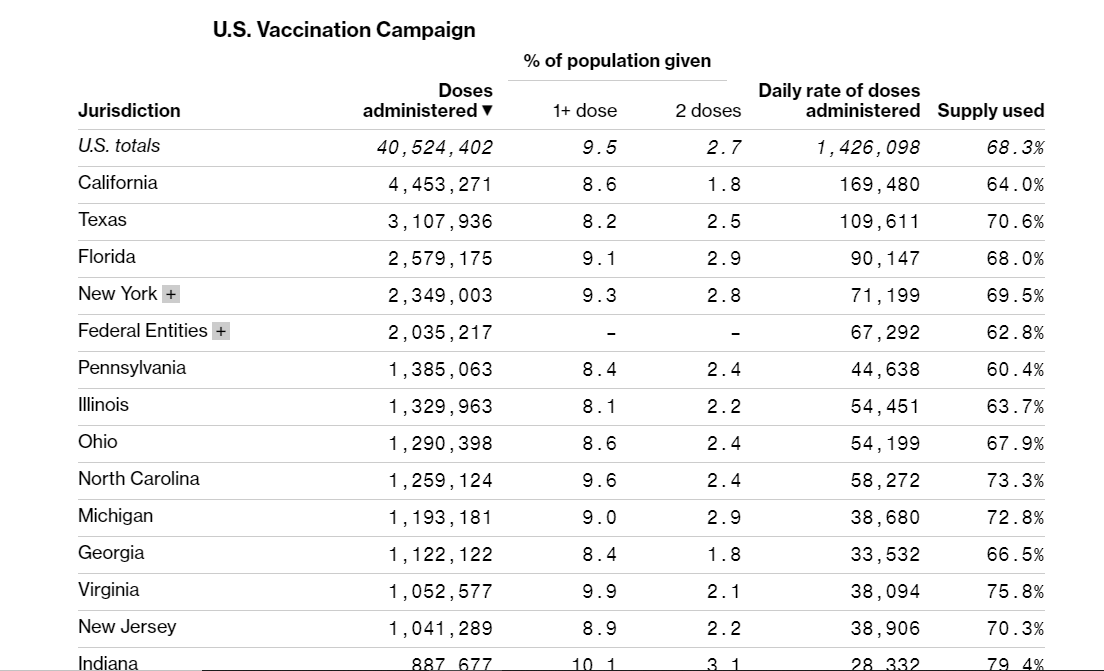
...🚨U.S. posts *first* 2M+ doses daily total...

🇺🇸US: 40.5M doses total
📈2.1M doses today; 7-day avg=1.43M/day
🧑‍🤝‍🧑31.1M people w/ at least 1 dose, 8.81M completed vaccination

bloomberg.com/graphics/covid…
⚠️We did NOT get updates in time today from Maryland + New Jersey, which may have caused a slightly lower total than usual. CDC did report totals, which may compensate.

U.S. leaders:
➕12 states over 1M doses admin
➕4 states over 2M

bloomberg.com/graphics/covid…
Data shift tonight thanks to @tsrandall (who you should follow for more analysis of the numbers), and @mariepastora

Global maps/tables and everything else below.

bloomberg.com/graphics/covid…
Read 5 tweets
5 Feb
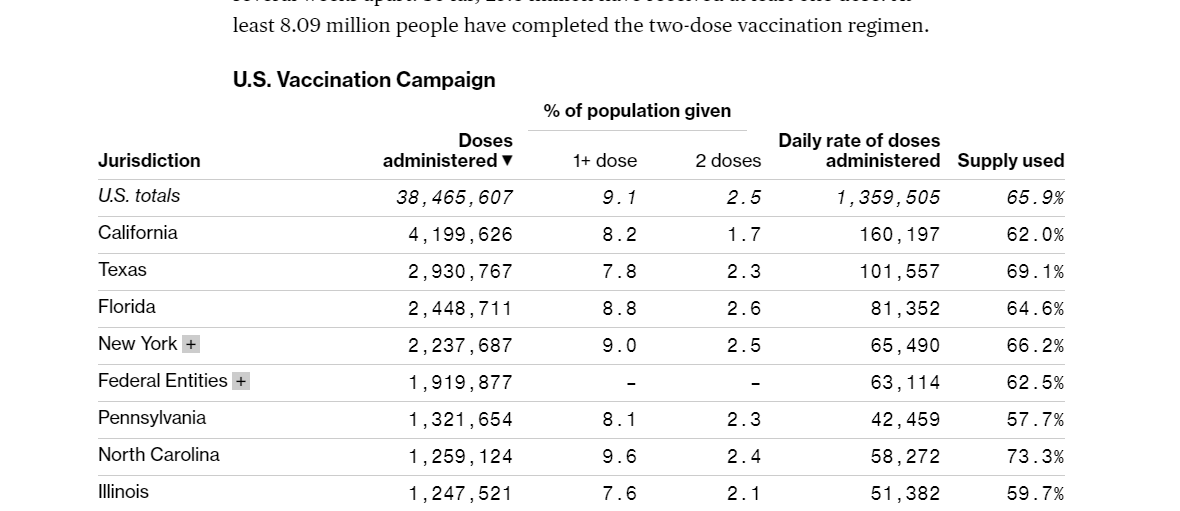
💉VACCINE DATA UPDATE (Feb. 5)💉

🇺🇸1.8M doses today; 7-day avg=1.36M/day
🏅Biggest U.S. day of reported vaccinations yet, by our count

📊US: 38.5M doses total
🧑‍🤝‍🧑28.9M w/ 1+ doses, 8.09M completed vaccination

bloomberg.com/graphics/covid…
As expected, the number of people completing vaccination is starting to pick up quickly. It should trail the first-dose rate by about 3.5 weeks (assuming supply remains steady)

bloomberg.com/graphics/covid…
Our full graphic, all our tables and charts, and lots of global data are available here.

bloomberg.com/graphics/covid…
Read 4 tweets
4 Feb
💉VACCINE DATA UPDATE (Feb. 4)💉

🇺🇸US: 36.7M doses admin
🧑‍🤝‍🧑28.7M w/ at least 1 dose
➕1.7M doses today; 7-day avg=1.34M

☝️U.S. snow lull appears to be over!❄️

bloomberg.com/graphics/covid…
In the U.S., states have started taking unused doses from nursing homes and pulling them back into their state distribution systems -- this should tighten up some of the slack in the system. Per @angelicalavito

bloomberg.com/news/articles/…
In our global rate chart, China makes infrequent reports. Those reports are very big. So it ends up looking...weird. This will likely clean up over time, but the data are the data.

bloomberg.com/graphics/covid…
Read 7 tweets

Did Thread Reader help you today?

Support us! We are indie developers!


This site is made by just two indie developers on a laptop doing marketing, support and development! Read more about the story.

Become a Premium Member ($3/month or $30/year) and get exclusive features!

Become Premium

Too expensive? Make a small donation by buying us coffee ($5) or help with server cost ($10)

Donate via Paypal Become our Patreon

Thank you for your support!

Follow Us on Twitter!