This is going to be a LONG thread on how I think about active investing.
They say all good investing is value investing. This is true in the sense that you're buying into a situation where the sellers are underpricing potential outcome. But…
They say all good investing is value investing. This is true in the sense that you're buying into a situation where the sellers are underpricing potential outcome. But…
Value investing doesn't = valuing income flows at $x and buying them at $x/n.
The essence of investing is in variant perception of probability distributions. Let me explain:
The essence of investing is in variant perception of probability distributions. Let me explain:
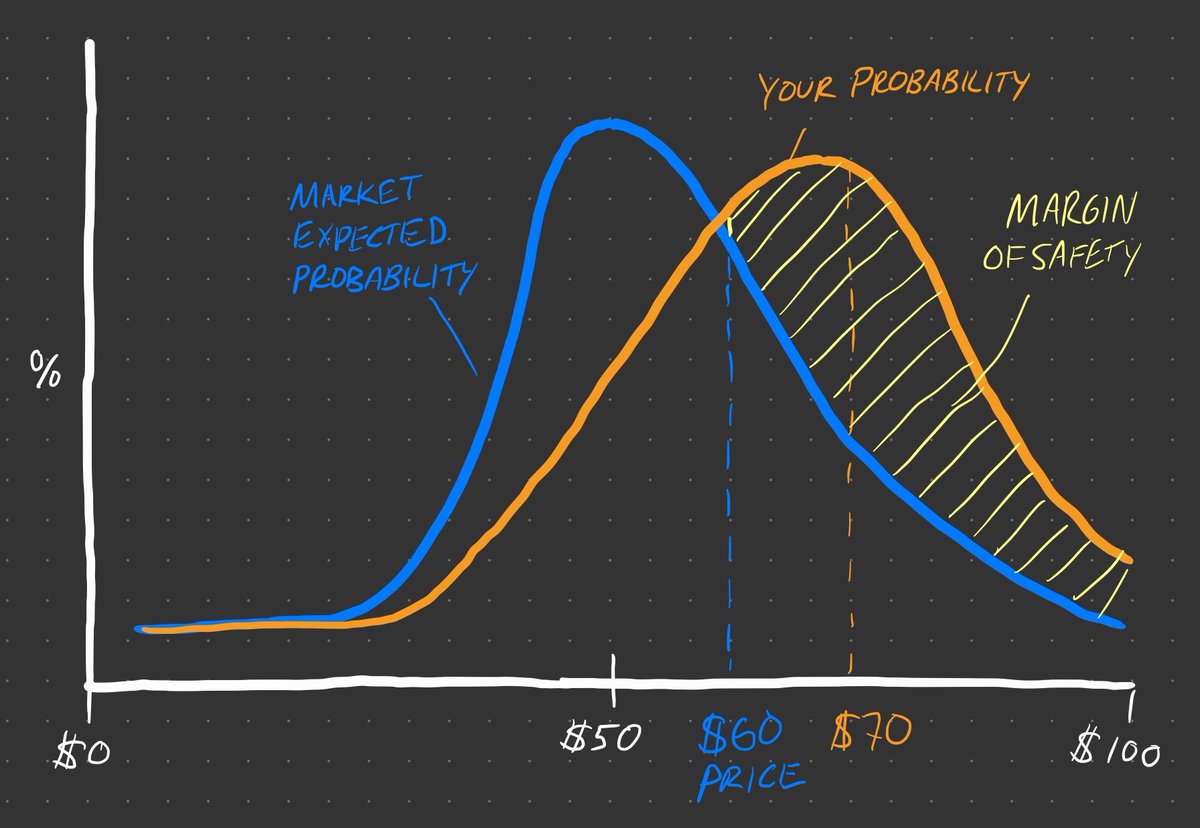
Market price is the result of expected value of potential future outcomes. So you could draw out a "market" probability distribution. For most stocks it would look bell-curvish. The price represents the $ value of area under the curve. 

When you're betting on a stock, you're implicitly saying your probability curve is not the same as the markets (hopefully skewed to the right).
***All investing is about probabilities.*** Any B-school student can add up asset values or do a DCF. Mr. Market only gets the *expected* value wrong, not the value in a given scenario.
Large margin of safety
= big edge
= low overlap in your estimated probability distribution vs. the markets
= your expectations - market expectations
= big edge
= low overlap in your estimated probability distribution vs. the markets
= your expectations - market expectations
Take a binary outcome to keep things simple (like bankrupt/not-bankrupt). $$ outcomes for each scenario are probably obvious to most market participants. You are betting on odds of outcome.
If market thinks odds are 20%, you don't want to make a bet that odds are really 23% b/c you likely could be wrong -- you want to bet when you think odds are 60%. This is "value investing".
The Nassim Taleb's of the world aren't capital V value investors, but they're doing the same thing. They think the tails of the curve are fatter than the market expects. Odds of extreme event higher than people think.

Same with momentum traders. What are odds crowd psychology will drive market to pay more for shares in near future? This is a historically reliable bias that is more predictable than many in value camp think.
Wide difference in odds can only come from breakdown in wisdom of crowds.
Crowd accuracy = size of crowd + diversity/independence of views + accuracy of individual views.
All interplay off each other: larger size or more diversity allows for less individual accuracy.
Crowd accuracy = size of crowd + diversity/independence of views + accuracy of individual views.
All interplay off each other: larger size or more diversity allows for less individual accuracy.
Each of these components can break down. Informational and Analytical disadvantages effect accuracy of individuals. Common psych biases effect diversity of views. Structural market aspects effect size of participants.
Doesn't matter the "market": businesses, debt, startups, land, currencies, political outcomes, horse races… If you can forecast odds better than average, you can make money in long-term.
Some markets are easier than others to find wide variant perceptions (less efficient), or get privileged access to info.
Productive assets have historically been easier to predict b/c there's a base "average" probability distribution that doesn't change radically. Average left tail risk also not as bad.
Similarly longer-term investing generally easier b/c odds are more driven by true underlying performance vs. short-term supply & demand.
My rule of thumb: If you hold a stock 10+yrs, ~70% of returns will come from reality of biz performance, 25% from difference in market odds at time of purchase, 5% random.
If you hold for only a few months however, at least 50% of return is going to be random supply/demand noise.
(This is for typical biz equities… in some very short-term trades returns can be driven mostly by variance in your vs. market odds. Like $GME recently both long+short.)
(This is for typical biz equities… in some very short-term trades returns can be driven mostly by variance in your vs. market odds. Like $GME recently both long+short.)
What about allocation and risk minimization? (aka bankroll management)
Kelly Criterion is the best way to allocate capital & manage risk. Full stop. Any other successful allocation method is either random or from simple heuristics that could be derived from Kelly (ie Buffett).
No, Buffett doesn't do the linear algebra required for advanced Kelly calculations. He has a neural net in his head trained from a million+ observations from age of 14 that does a rough version for him.
Those rules of thumb are likely related to: perceived margin of safety (compensation for uncertainty), liquidity, downside if wrong, upside if right, ability to influence outcome, etc.
All probability predictions have to be examined through lens of process, not outcome. If I predict an event has 80% odds & it happens, did I do well? I'll never know. If true odds were 50/50, I got it wrong. Outcome can only be judged over a LOT of bets.
And even after a lot of bets, you have to subtract performance of average investor in the primary area(s) you bet in. You invest primarily in tech cos? Subtract avg tech performance over period.
Buffett Partnership compounded at 29.5% for 12 years. Small company stocks averaged 19% for same period. So Buffett's 12 year edge was 10%/year. This is very good.
Annual return =
return of comparable index
+ compounded average edge
- fees
return of comparable index
+ compounded average edge
- fees
This is another reason why "stocks" are a good: it's a non-zero sum game, especially keeping fees low. Sports betting on other hand, 0% base - 5% vig = much larger edge needed. Negative sum games are hard.
And with that, I conclude by echoing Buffett: Skip active investing and just put $$ in an low-cost index fund :) Don't be fooled by your performance over past 5 years.
/end for now
/end for now
And a follow up with more on how $GME can be viewed this way:
https://twitter.com/maxolson/status/1362464834961334273
• • •
Missing some Tweet in this thread? You can try to
force a refresh