I've seen many news articles cite that "the UK variant could be the dominant strain by March". This is emphasized by @CDCDirector.
While this will likely to be the case, this should not be an automatic cause for concern. Cases could still remain contained.
Here's how: 🧵
While this will likely to be the case, this should not be an automatic cause for concern. Cases could still remain contained.
Here's how: 🧵
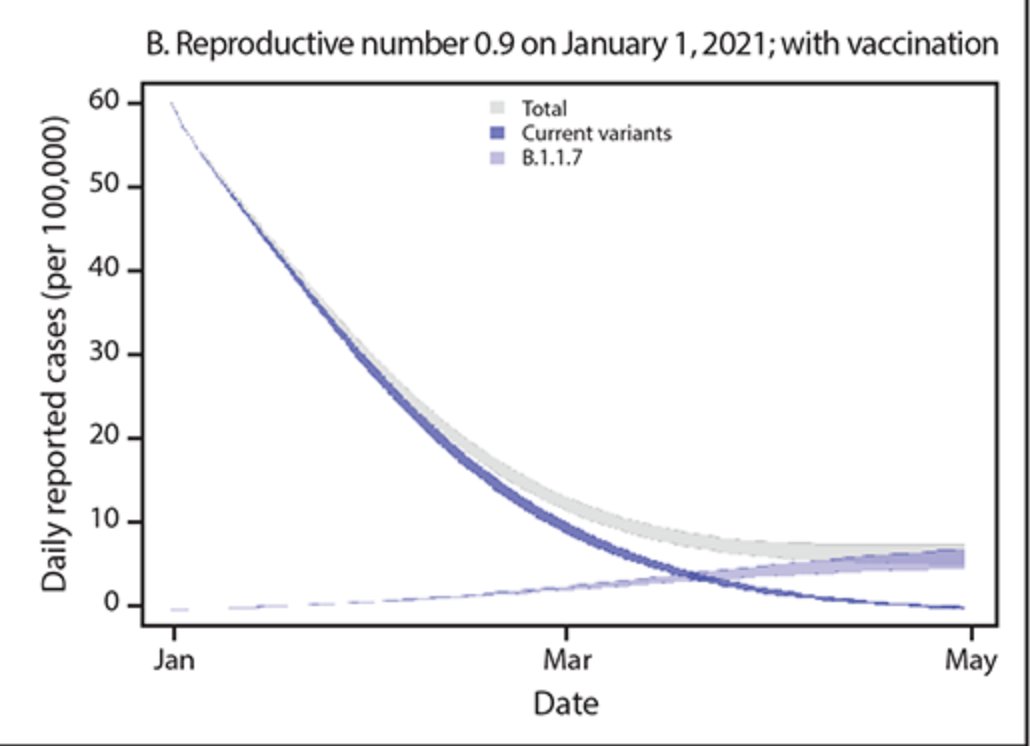
One of @CDCgov's own models has tracked the true decline in cases quite accurately thus far.
Their projection shows that the B.1.1.7 variant will become the dominant variant in March. But interestingly... there's no fourth wave. Cases simply level out:
cdc.gov/mmwr/volumes/7…
Their projection shows that the B.1.1.7 variant will become the dominant variant in March. But interestingly... there's no fourth wave. Cases simply level out:
cdc.gov/mmwr/volumes/7…
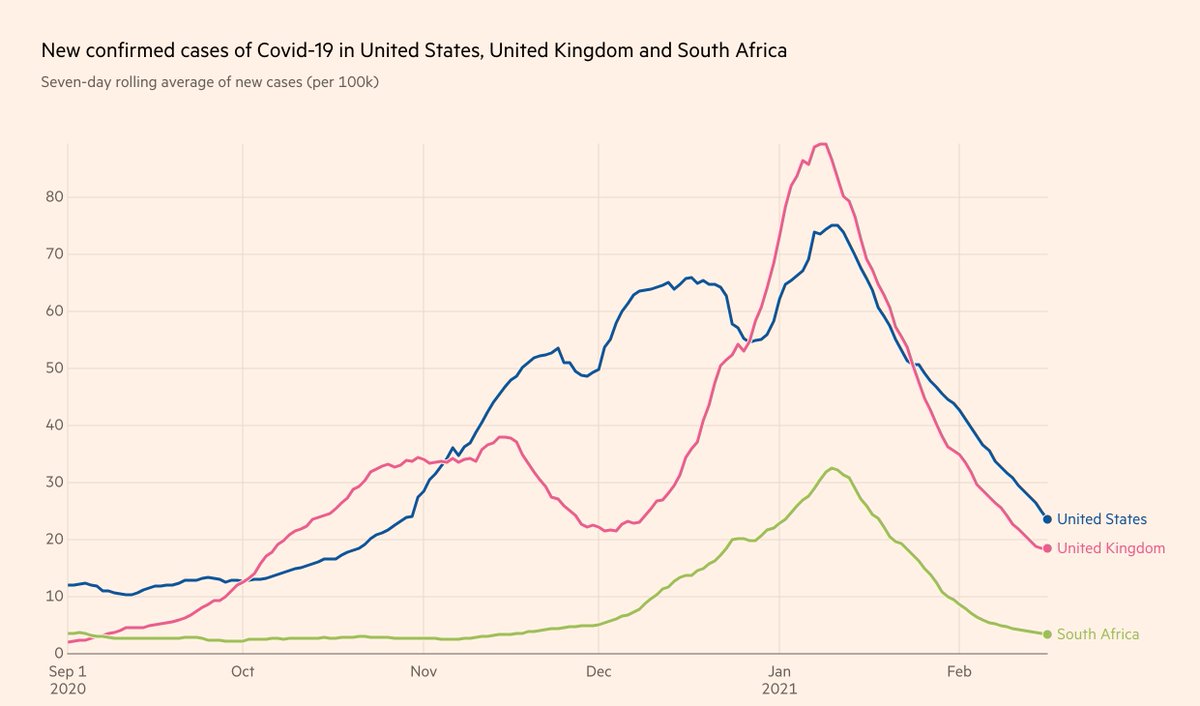
Just because a variant becomes the dominant strain does not automatically mean we will see a repeat of Fall 2020.
Let's look at UK and South Africa, where cases have been falling for the past month, in unison with the US (albeit with tougher restrictions):
Let's look at UK and South Africa, where cases have been falling for the past month, in unison with the US (albeit with tougher restrictions):
Furthermore, the claim that the "variant is doubling every 10 days" is false. It's the *proportion of the variant* that is doubling every 10 days.
If overall prevalence drops during the studied time period, the true doubling time of the variant is actually much longer 10 days.
If overall prevalence drops during the studied time period, the true doubling time of the variant is actually much longer 10 days.
Simple example:
Day 0: 10 variant / 100 cases -> 10% variant
Day 10: 15 variant / 75 cases -> 20% variant
Day 20: 20 variant / 50 cases -> 40% variant
1) Proportion of variant doubles every 10 days
2) Doubling time of variant is actually 20 days
3) Total cases still drop by 50%
Day 0: 10 variant / 100 cases -> 10% variant
Day 10: 15 variant / 75 cases -> 20% variant
Day 20: 20 variant / 50 cases -> 40% variant
1) Proportion of variant doubles every 10 days
2) Doubling time of variant is actually 20 days
3) Total cases still drop by 50%
Given these facts, I think headlines along the lines of "CDC warns UK variant could be dominant strain by March" can be misleading.
It has the consequence of instilling fear in the public, who are much more likely to misinterpret it as "there will be another bad wave".
It has the consequence of instilling fear in the public, who are much more likely to misinterpret it as "there will be another bad wave".
The amount of pessimism still present and being proliferated does not match a reality where:
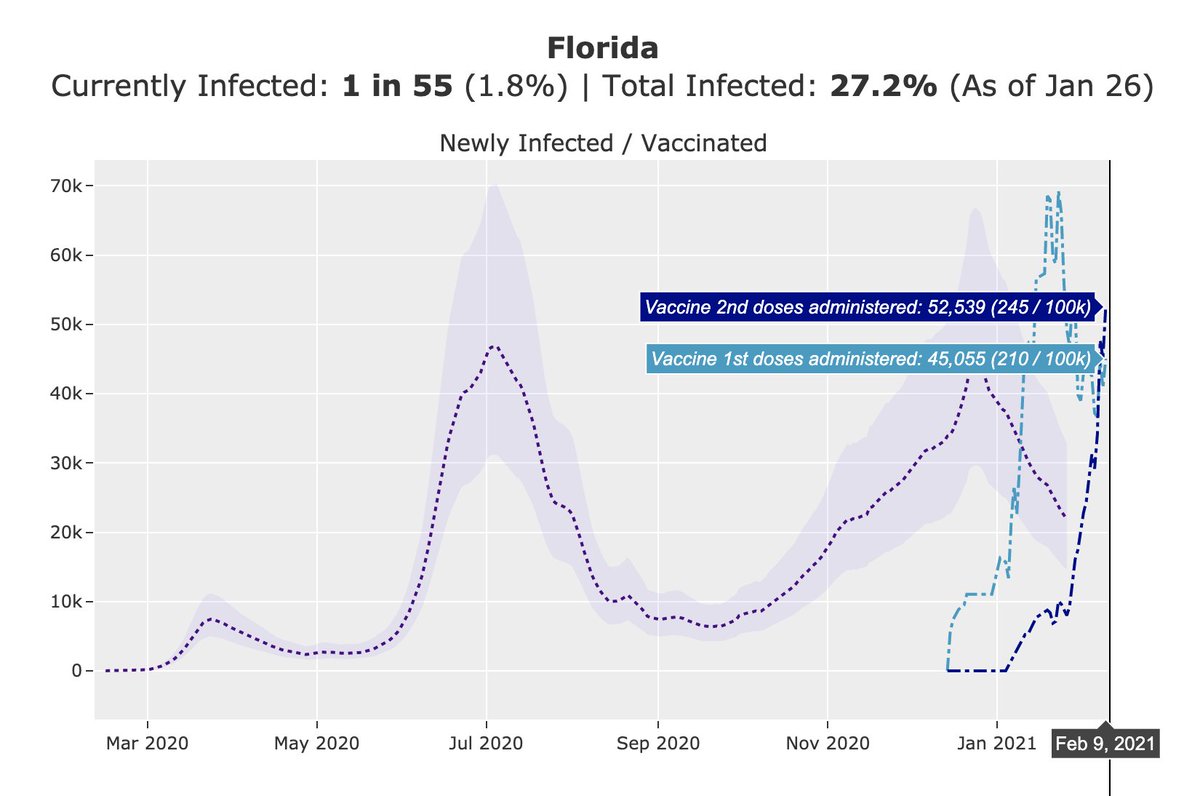
1) Cases and hospitalizations have fallen by more than half in the past month (and still falling)
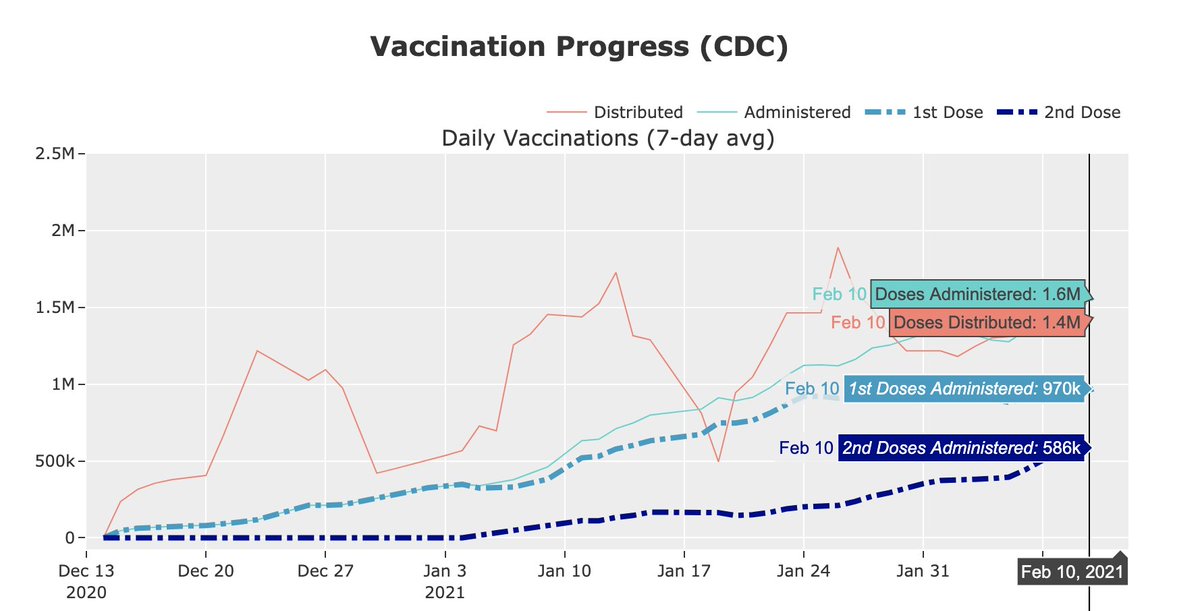
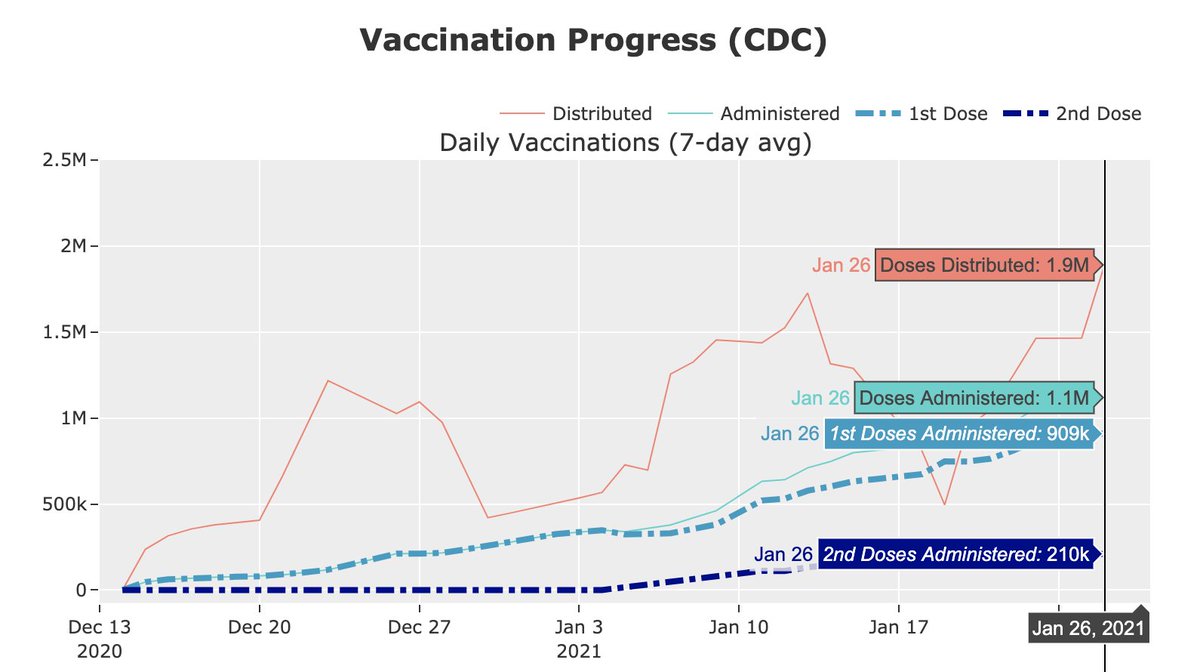
2) We have administered the vaccine to 40M+ people, with 1M new vaccinations per day
1) Cases and hospitalizations have fallen by more than half in the past month (and still falling)
2) We have administered the vaccine to 40M+ people, with 1M new vaccinations per day
Of course, there's a very possible scenario that we'll see a fourth wave beginning in mid/late March and peaking in April/May. I'm not trying to downplay that.
But I'm baffled to see such a high level of confidence from the public health community that a fourth wave will happen.
But I'm baffled to see such a high level of confidence from the public health community that a fourth wave will happen.
I was told last year that the purpose of restrictions/interventions is to "flatten the curve". That the main goal is to make sure we do not overwhelm our healthcare system.
That messaging seems to have been shifted to "eliminate the curve". Why?
That messaging seems to have been shifted to "eliminate the curve". Why?

It's possible that selection bias may be at play (i.e. experts that are more confident about a fourth surge will have their voices amplified).
In any case, the future trajectory of the variant is still unclear, at least from the data. It's good to tread with cautious optimism.
In any case, the future trajectory of the variant is still unclear, at least from the data. It's good to tread with cautious optimism.
Here's a great expert analysis @trvrb for what's next. It lays out the facts and expresses the uncertainties in the near term. The truth is not always headline-worthy.
https://twitter.com/trvrb/status/1362438562449293312
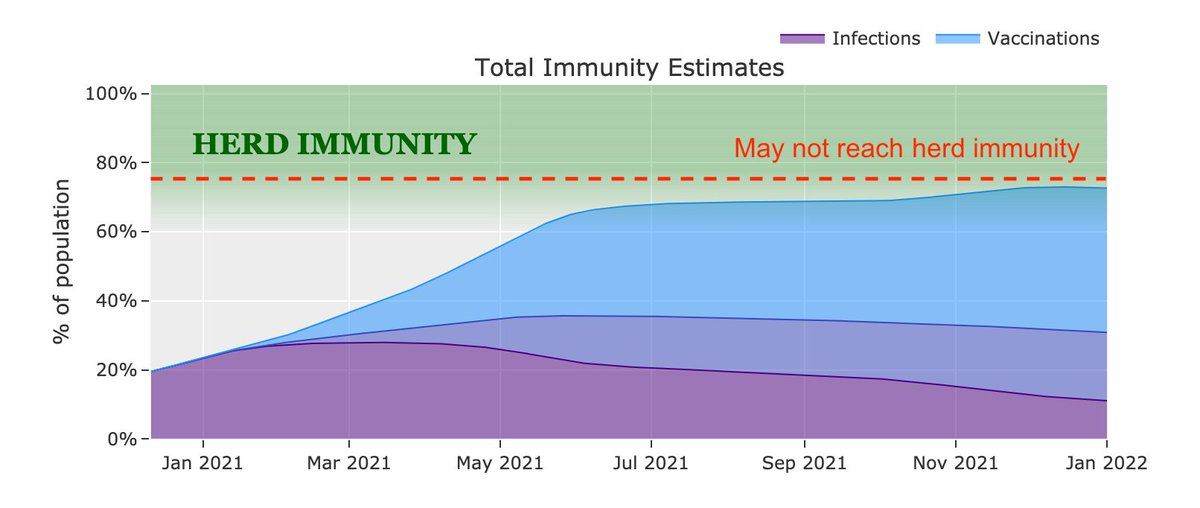
Update: Here is a possible projection that shows a fourth wave in infections that peaks in April, but at a significantly lower level than the fall wave.
Obvious caveat that there is a high level of uncertainty.
Source: covid19-projections.com/path-to-herd-i…
Obvious caveat that there is a high level of uncertainty.
Source: covid19-projections.com/path-to-herd-i…

• • •
Missing some Tweet in this thread? You can try to
force a refresh