Wed Jan 27 Weekly Vaccination Update:
Given no unforeseen supply issues, we estimate that the general public can receive the vaccine by April.
We also estimate over 60% of the US adult population will be fully vaccinated by June.
covid19-projections.com/path-to-herd-i…
Given no unforeseen supply issues, we estimate that the general public can receive the vaccine by April.
We also estimate over 60% of the US adult population will be fully vaccinated by June.
covid19-projections.com/path-to-herd-i…

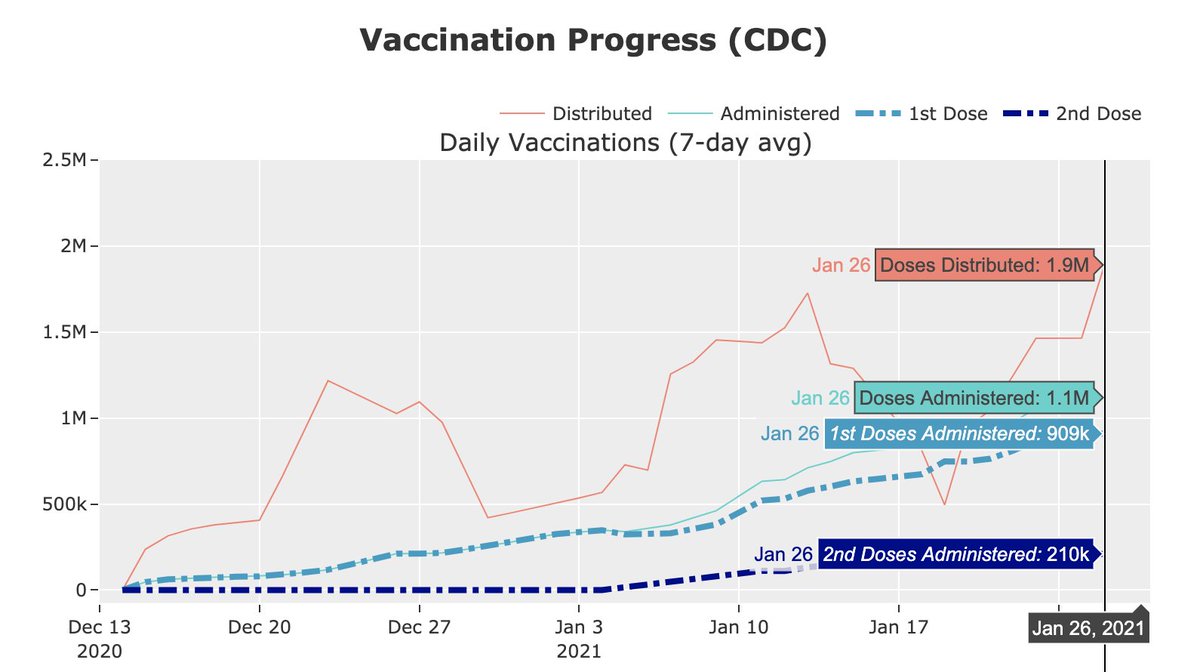
These estimates are driven by data. In the past week, over 1 million doses were administered per day, a 20% week-over-week increase.
While there are news reports of anecdotal supply issues, this has not shown up in the data. If this changes, we will update accordingly.
While there are news reports of anecdotal supply issues, this has not shown up in the data. If this changes, we will update accordingly.
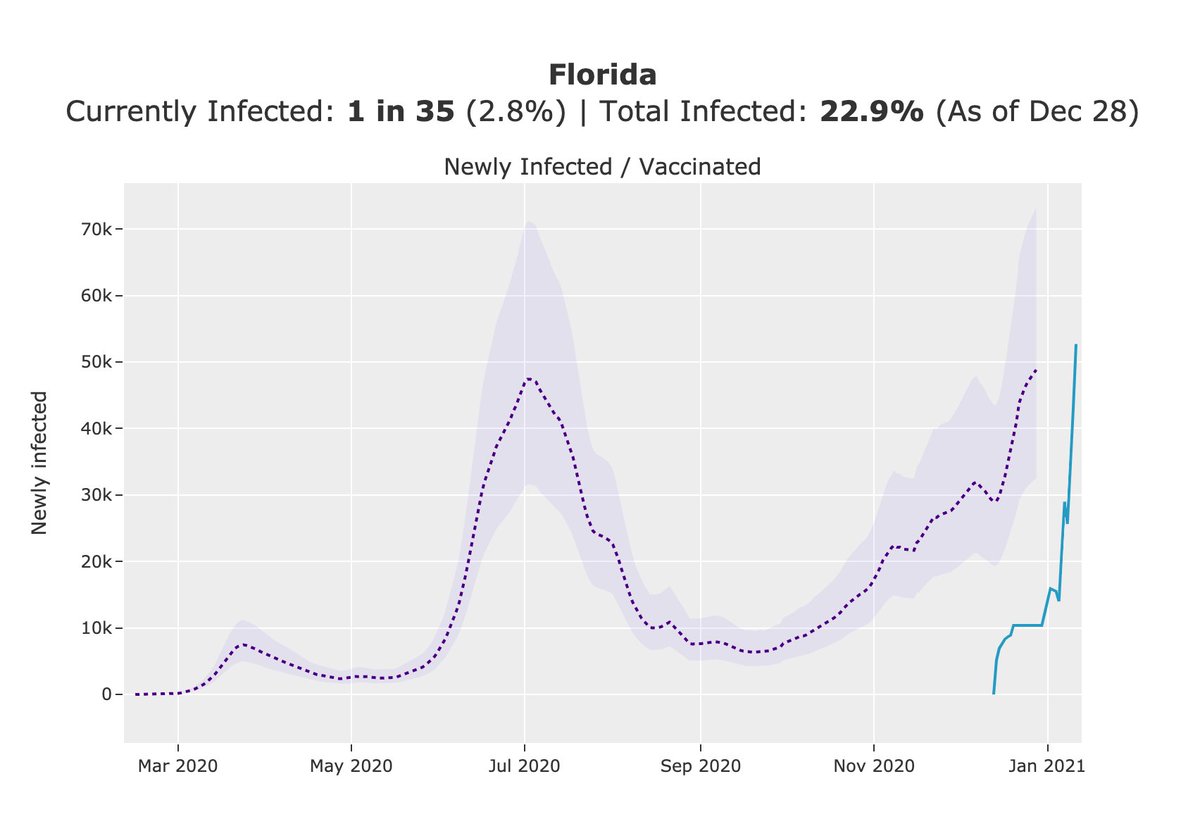
Nationwide, new infections are decreasing quickly while vaccinations are steadily increasing.
But around 500k people are still being infected per day, double the summer peak.
The drop in infections is more likely due to a post-holiday slowdown rather than vaccinations.
But around 500k people are still being infected per day, double the summer peak.
The drop in infections is more likely due to a post-holiday slowdown rather than vaccinations.

We are also factoring in rollout of the single-dose Johnson & Johnson vaccine starting in late February/early March.
This should allow us to vaccinate 2M new individuals per day by April. This is backed by @POTUS's push for more vaccines.
This should allow us to vaccinate 2M new individuals per day by April. This is backed by @POTUS's push for more vaccines.
https://twitter.com/NPR/status/1354180375132712960
Some people asked why new vaccinations drop in the spring and rise in the fall.
The drop is due to the fall in demand for the vaccine as everyone who wants to get vaccinated are vaccinated (~70% of adult population).
The rise in the fall is from rollout of the children vaccine.
The drop is due to the fall in demand for the vaccine as everyone who wants to get vaccinated are vaccinated (~70% of adult population).
The rise in the fall is from rollout of the children vaccine.

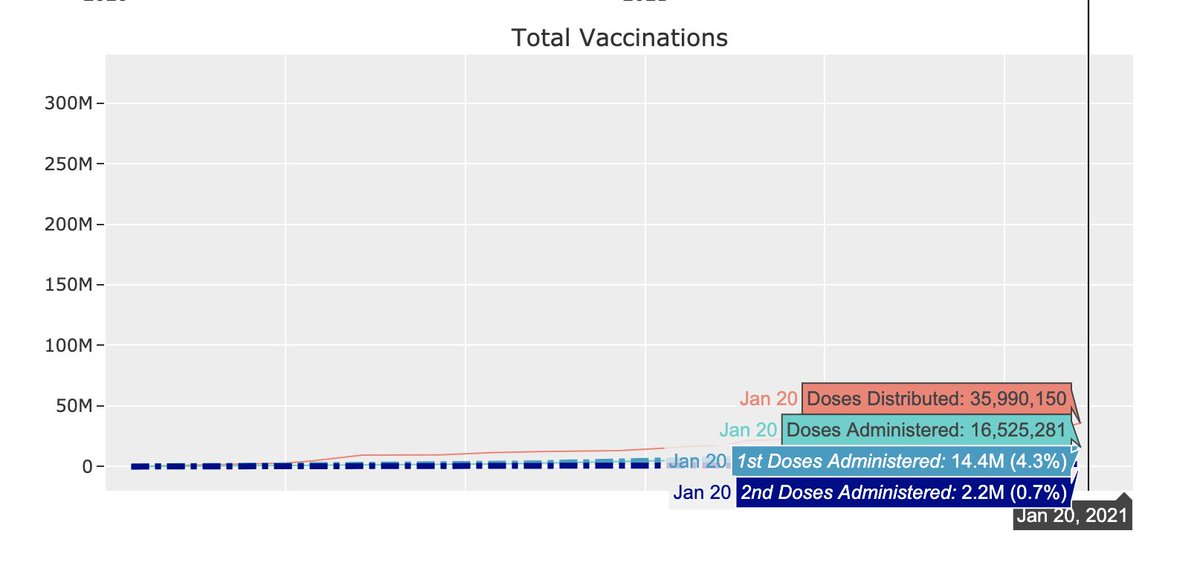
With all that said, right now only 1% of the population have full protective immunity from the vaccine.
We're picking up speed, but it's still a long road ahead.
We're picking up speed, but it's still a long road ahead.

• • •
Missing some Tweet in this thread? You can try to
force a refresh