Nifty Sectors

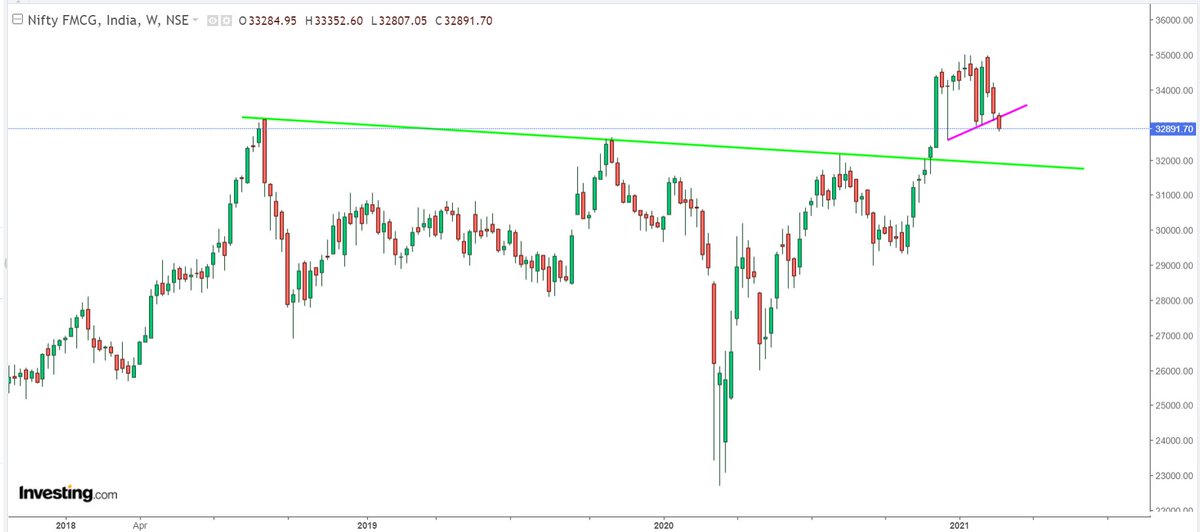
1. Nifty FMCG - Breakdown can test 31850 green line
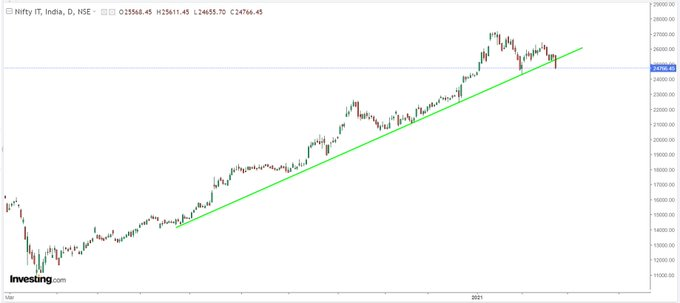
2. Nifty IT - Below 24300 momentum on downside
Nifty Pharma - Serious breakdown can do 10800
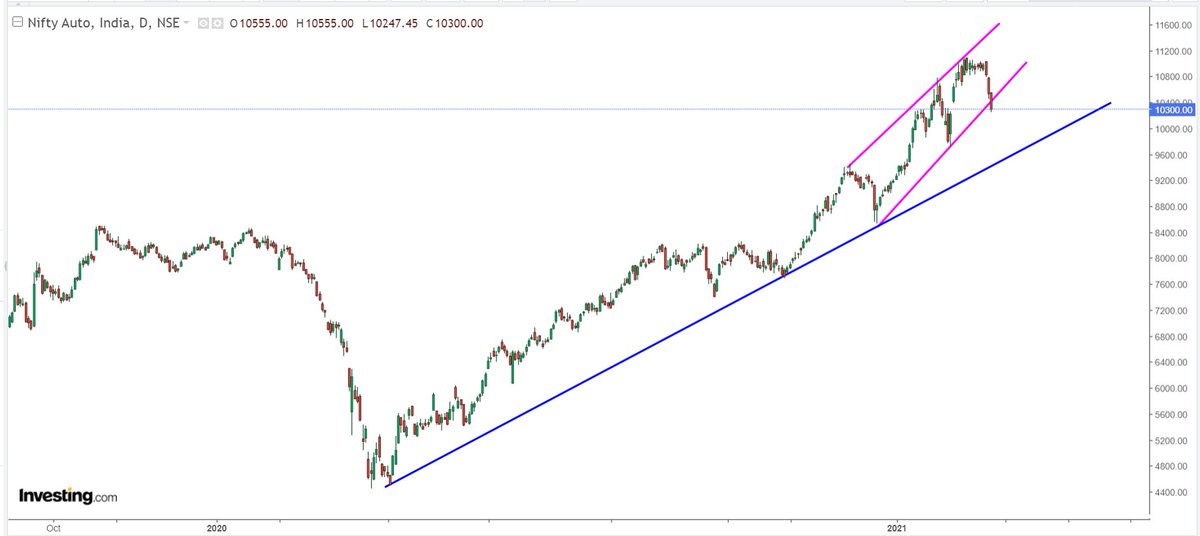
Nifty Auto back in reverse gear. support at blue line
Nifty Metal threatning to break with raising wedge formation on 240min chart. suppor at greenline

• • •

Missing some Tweet in this thread? You can try to force a refresh
 

Keep Current with Shivaji Vitthalrao🇮🇳

Shivaji Vitthalrao🇮🇳 Profile picture

Stay in touch and get notified when new unrolls are available from this author!

Read all threads

This Thread may be Removed Anytime!

PDF

Twitter may remove this content at anytime! Save it as PDF for later use!

Try unrolling a thread yourself!

how to unroll video
  1. Follow @ThreadReaderApp to mention us!

  2. From a Twitter thread mention us with a keyword "unroll"
@threadreaderapp unroll

Practice here first or read more on our help page!

More from @shivaji_1983

19 Feb
1 observation made on Index since feb 2014 which I will reveal to limited people. 😀👍

#Secret 😁😁😉😉

Please do not DM me😀🙏🙏
Nifty Observation

1. Since 2014 all rallies lasted for either 6 or 13 months pattern.

2. Current rally if repeats history expect good correction from 23rd March or 6th April 2021(13th Month)

3. All the rallies retraced 38-50% of previous move in 2-3 months Image
4. Except 2015-16 fall (9119-6825) which took more time to correct rest all the falls are done in 2-3 months

5. 13 is a fibo number. Expect either new high or lower top formation. Let the market decide it. Strength of next upmove will decide the next big move in markets
Read 6 tweets
23 Sep 20
Nifty Analysis

1. Dow theory considers only closing price

2. Since March 2020 index making Higher top and higher bottom pattern.

3. Last major bottom was at 10880
mini bottoms at 11,110 and 11,185 which were breached in last 2 days. Indicates short term down trend Image
4. Last top was at 11794 and then at 11618.
Previous bottoms 11,100 and 11185 were broken yesterday as shown by green lines.

5. Till last major bottom 10,880 is not broken, we may not see major downside.

6. Index dint close below 11100 though intraday price went till 11,020+ Image
7. As long as price is above 10,880 major bottom it may go into sideways. only a close below 10880 can give more downside targets.

8. After rally from 7500 to 11800 index at times goes into sideways if major bottom is not broken. Break below that confirms medium term down trend Image
Read 27 tweets

Did Thread Reader help you today?

Support us! We are indie developers!


This site is made by just two indie developers on a laptop doing marketing, support and development! Read more about the story.

Become a Premium Member ($3/month or $30/year) and get exclusive features!

Become Premium

Too expensive? Make a small donation by buying us coffee ($5) or help with server cost ($10)

Donate via Paypal Become our Patreon

Thank you for your support!

Follow Us on Twitter!