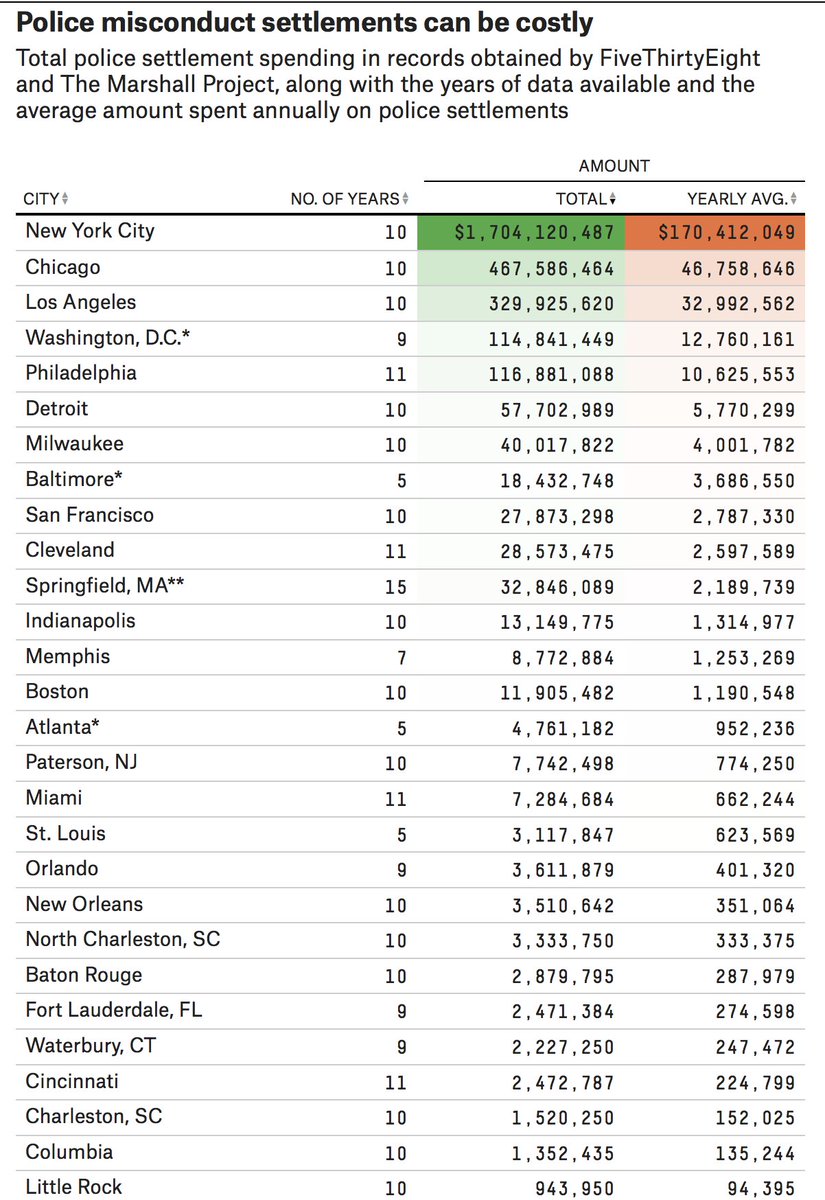
Last summer, we set out to find out how much cities spend on settlements for police misconduct -- bills often footed by taxpayers.
We got data from 31 cities. We also found that the data is basically impossible to compare across time or city.
53eig.ht/3qCulG2
We got data from 31 cities. We also found that the data is basically impossible to compare across time or city.
53eig.ht/3qCulG2

Cities don't track this money in a straightforward, comparable way. Indeed, some don't seem to track it at all.

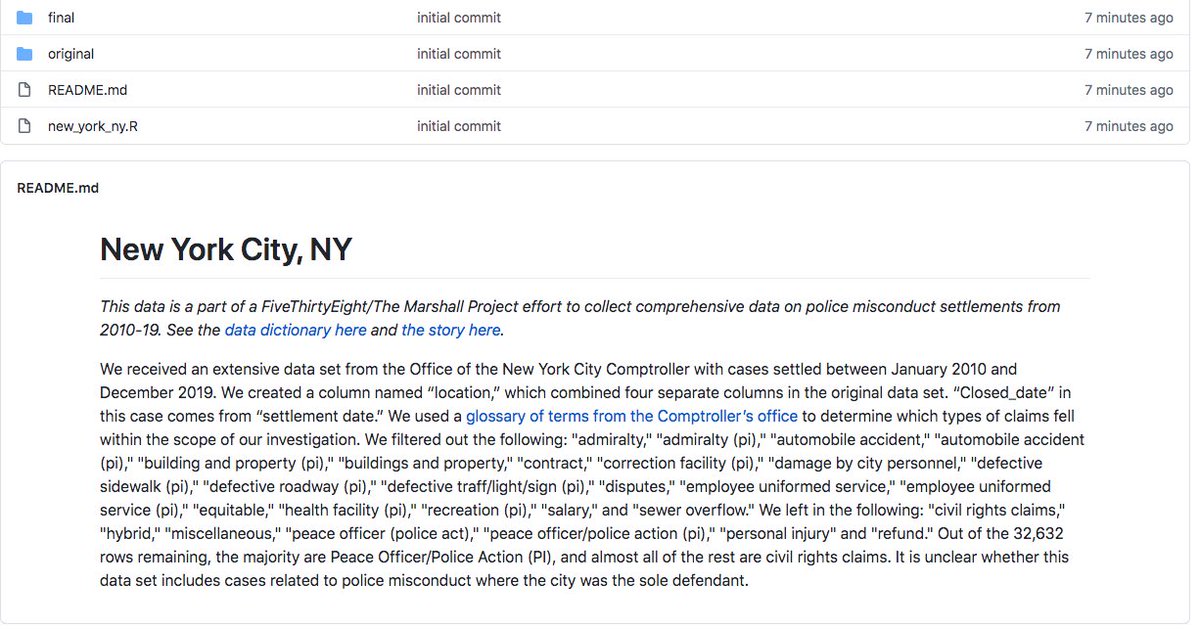
The data is in no way standardized. Some cities provided no description of what each settlement was for. Other provided categories -- but those categories differed wildly. Even when they had the same name ('civil rights'), we couldn't assume it meant the same thing.

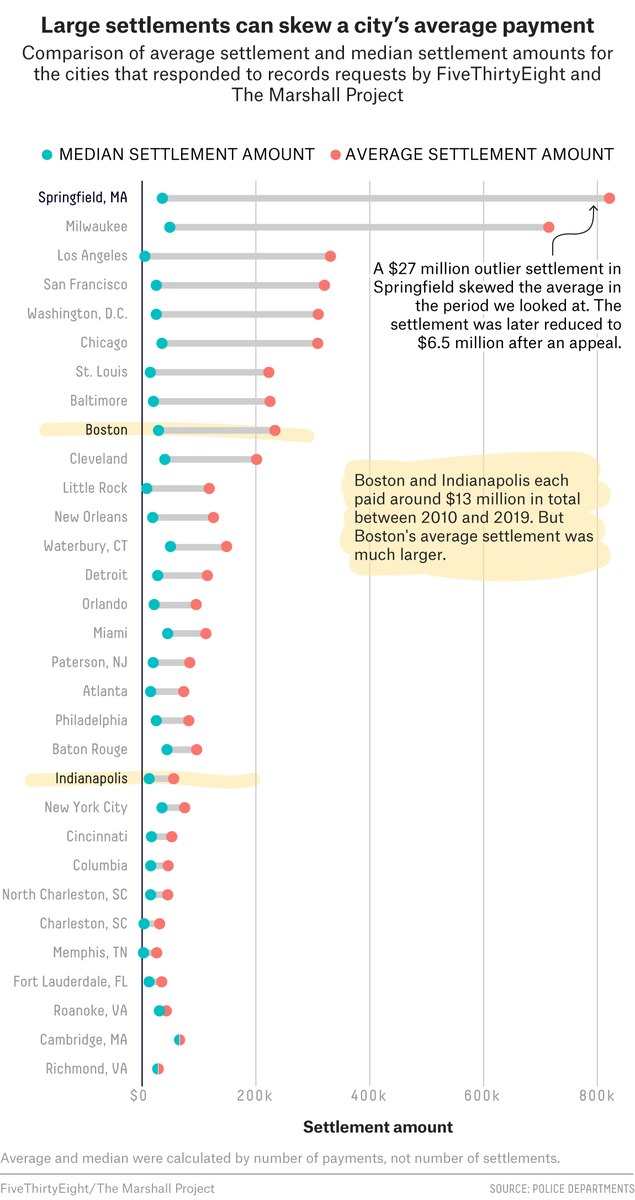
Cities also differed wildly in the number of settlements and how costly each settlement was. But again, it was hard to know what to make of those differences.
Fundamentally, so many factors affect whether lawsuits are even filed -- and whether cities decide to settle -- that it's unclear whether high totals are a bad thing (more police misconduct) or a good thing (victims being more likely to get compensated).

The bottom line: Unless cities do a better job collecting this kind of data -- in some cases, any kind of job, frankly -- it's incredibly hard to hold departments accountable for the misconduct that they perpetrate.
So grateful to @ameliatd, @sharmad23, @mayasweedler, @jazzmyth, @LikhithaBu, @eads and many others at @FiveThirtyEight and @MarshallProj for the months and months of data munging, head scratching, and cryptic conversations with city officials that went into this!
We made a conscious decision *not* to adjust for the size of the city or the police force because we didn't want to make the data seem more comparable than it is. There are many reasons this isn't an apples-to-apples comparison!
https://twitter.com/WillFleischman/status/1363872166173945857
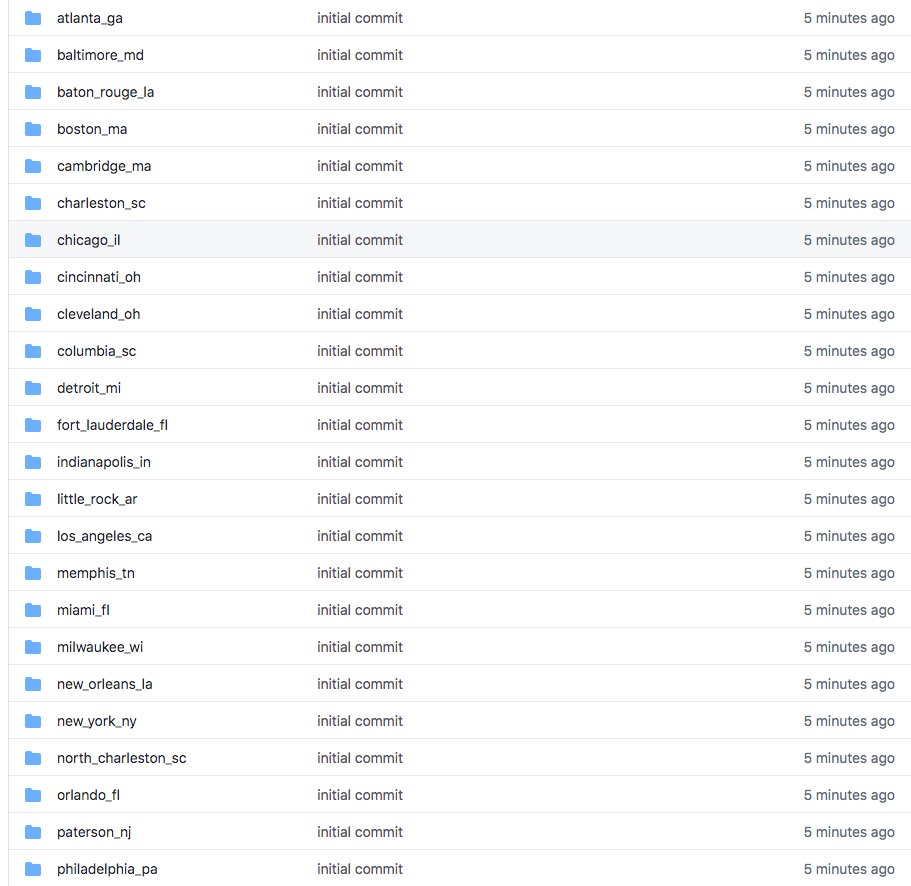
And with a fashionably late arrival, here's all the data!
https://twitter.com/laurabronner/status/1363961281905106956
• • •
Missing some Tweet in this thread? You can try to
force a refresh