
💉Who wants to take the vaccine? Together with @jrgingrich, @Jackstilgoe and Martin W Bauer, I've conducted a 2 wave panel study of how people in the UK feel about taking the vaccine. And it's pretty good news, though with some challenges left. 🧵1/n
ox.ac.uk/news/2021-02-2…
ox.ac.uk/news/2021-02-2…
Here's the good news. Whereas only 50% of people were "very likely" to take the vaccine in early October, over 3/4 are now. Adding people who are "likely" that's moved to almost 90%. And many demographic gaps (gender, ethnicity) have closed. See rpubs.com/benwansell/729… 🎺🎉. 2/n
What are the challenges? There are still a group of people who are cautious. About 7% of our sample are "very unlikely" in both waves - that's the core anti-vac group. But we also find that young people, non-voters, poorer households, and Reform UK supporters (!) are unlikely 3/n
Now let's get to the details. We contacted 1642 people through @YouGov on Sep30/Oct1 last yr and followed up with them in the first week of Feb. We were able to retain almost 3/4 of the sample (1219). Demographically there were no major differences in attrition rate. 4/n
We asked how likely people would be to take the vaccine with a 4 point scale (v unlikely, unlikely, likely, v likely) and we also use a binary scale where we combine the first 2 & last 2 groups. In 2nd wave (13%) people have had the vaccine - they are 'very likely' ;) 5/n
Let's look at the big picture, comparing wave 1 (Oct) vaccine willingness to wave 2 (Feb). Start with the first wave. We see about 50% people were very likely & 28% likely, leaving 22% in the unlikely groups (excl DK which was 8%). 6/n 

Now turn to February. Here we include people who've been vaccinated already in the very likely group. The BIG difference is the shift to "very likely". Now 80% of people! This is mostly (but not all) explained by likely moving to very likely. Confidence. 7/n

A big advantage of our panel study is we can see who moved to "very likely". And the great news is that we also see a major shift to "very likely" from people who 'didn't know' in October & even those who were "unlikely". In fact, a majority of these groups! 8/n

Once we look at shifts to both "likely" and "very likely", this is even clearer - 3/4 of people who were "unlikely" are now "likely" or better. 90% of those who were Don't Knows!. Only a third of the "very unlikely" group and 1/4 of "unlikely" remain unwilling. 9/n

So I think we can call this good news! We can also see when we compare attrition rates in the survey that's it's not the case that anti-vac folk drop out more from the 1st to 2nd wave - see the sample comparisons at rpubs.com/benwansell/729…. 10/n
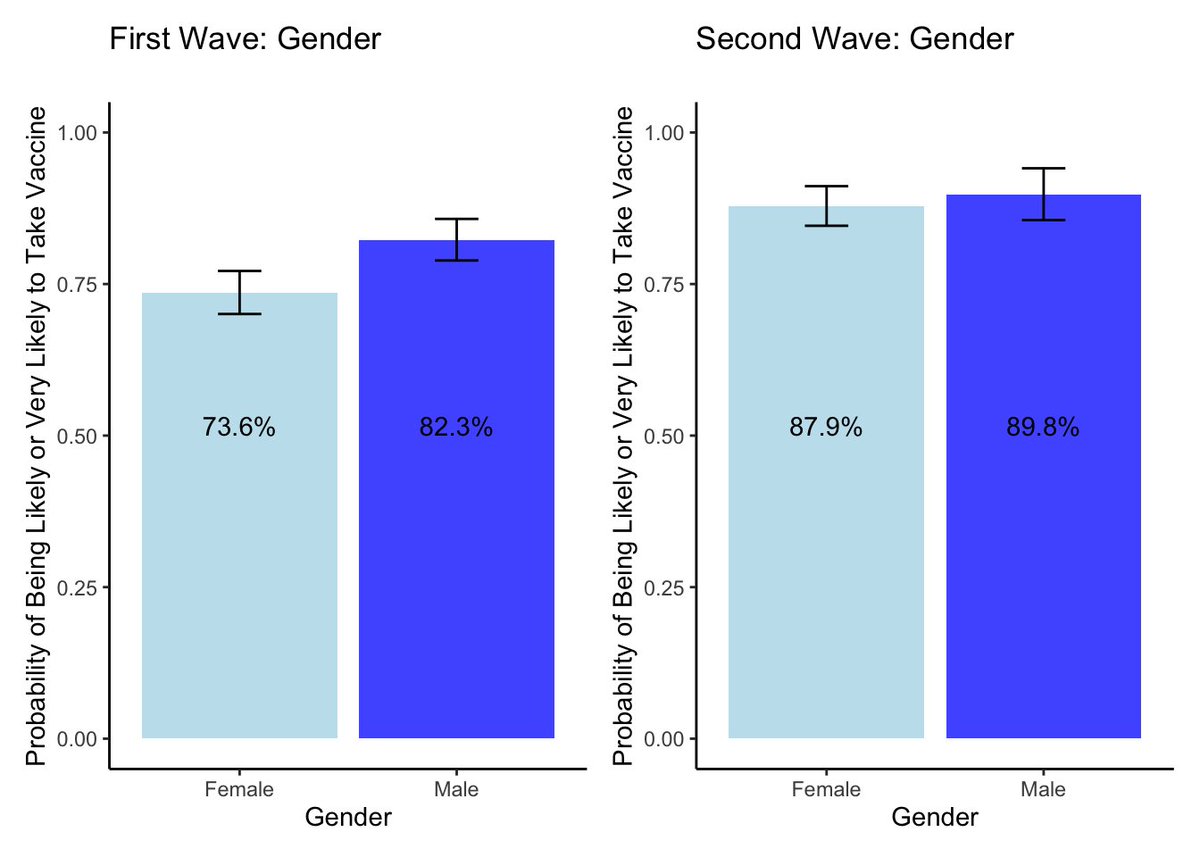
What are the challenges remaining if we want high vaccine uptake? We can look at vaccine willingness - using our binary measure - by demographic/political groups to see how people differ. Here we see that women, who were more unwilling, have now converged upwards toward men. 11/n
When we look at age, we still see a strong age gradient in vaccine willingness but a notable increase in vaccine support among the 50-59 group in particular. I guess they know they are in Group 9 of the JCVI order! 12/n

We also see a strong income gradient. Lower income households remain substantially less willing to take the vaccine than high income households and if anything this has widened since October. 13/n

There's no really big effect of education, though we do see evidence that people whose highest attainment is A-Levels or equivalent have jumped up a lot since October. But overall, education for once is not the big explanatory factor in British life! 14/n

There's been lots of talk in the press about vaccine skepticism among ethnic minorities. We also found this in October but the good news is that by Feb that gap had narrowed. But caution - we don't have a large sample of this group and there is slightly higher attrition. 15/n

Right now for the stuff that everyone loves - political differences😬. We do find a Brexit difference. But... it's not that Brexit voters are less likely to take the vaccine - compared to non-voters in 2016 - it's that Remainers appear to be especially pro-vaccine. 16/n

It turns out this is one of the strongest results - if we whack all of our variables into a regression, Brexit vote, along with age, is one of the most robust predictors. ¯\_(ツ)_/¯. We'll have a hint why in a second. 17/n
If we turn to 2019 General Election 2019 we see one thing really jump out - non-voters are especially unwilling to take the vaccine. There's also (weaker) evidence that Brexit Party voters and Green Party voters are more unwilling. And you know who loves vaccines? SNP voters 18/n

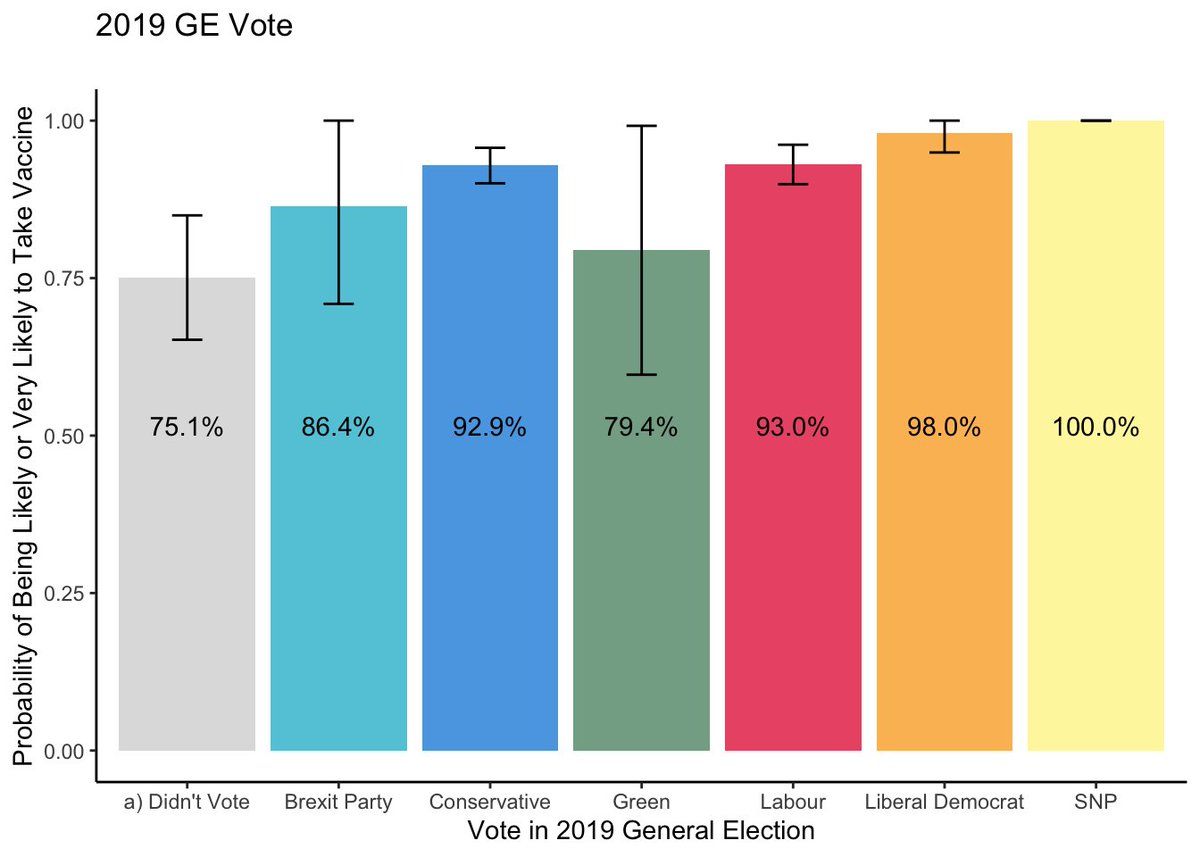
Perhaps surprisingly, Tory and Labour voters are almost identical. So here we have the BoJo-Corbyn convergence we all dreamed of! And that holds up if we look at 2021 vote intention. But we also see Reform UK fans especially unwilling to take the vaccine. 19/n

OK that's the top line stuff but there's some more interesting wrinkles. In the 2nd wave we used a survey experiment to see if mentioning Pfizer approval speed or AZ/Ox creation changed responses. It didn't! So no sign of vaccine nationalism 20/n

We also asked whether people approved of various government policies and their performance. And it's pretty good news for the government, with one exception. Let's begin with the good news. Here is approval of the government's performance in rolling out the vaccine. 21/n

Pretty decent right? And here is approval of the regulator's speed in approving vaccines. No sign of any real concern about the process being too quick. 22/n

Same goes for views about the priority order whereby older people and health workers get vaccinated before other key workers such as teachers. People really do approve of this (something to ponder Keir?) 23/n
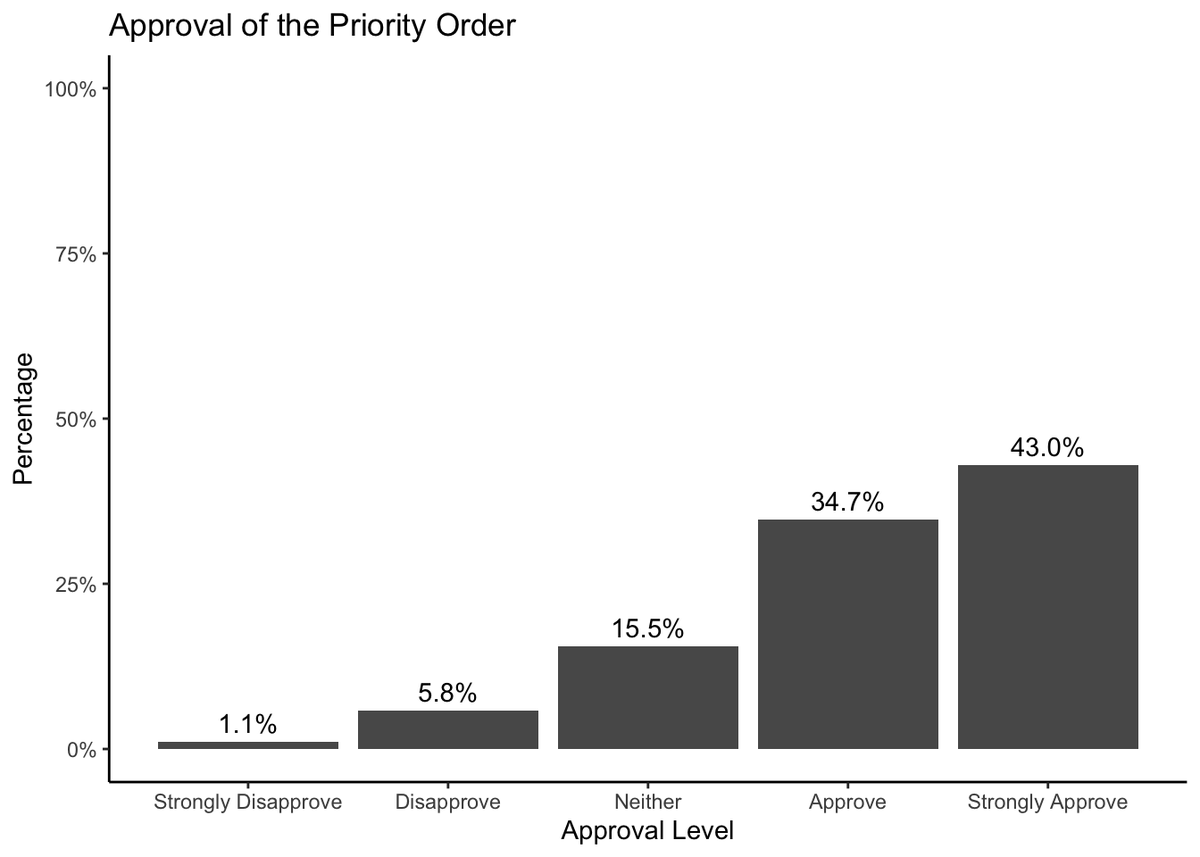
What is quite funny is that approval of the priority order suddenly jumps for fifty-year olds, who just so happen to be the last group in the JCVI's list (graph on right). Who says self-interest doesn't matter for vaccines?! 24/n

Where there is less support is with the decision to delay the second dose. People still have a number of concerns about this and it's where messaging might be most crucial, particularly given recent clinical findings that the delay could actually be positive. 25/n

So that's more or less a wrap! Phew. You can read through the results at much greater length at rpubs.com/benwansell/729… or download a pdf version at benwansell.files.wordpress.com/2021/02/coping… 26/n
There's lost more to come from the surveys we ran, including public trust in scientists, experience of the furlough scheme, views about who government pandemic policy benefited and so on. We'll release this over coming weeks [breathes out...] 27/n
Hopefully of interest to @Dannythefink @melindacmills @ThatRyanChap @anandMenon1 @sarahobolt @drjennings @DrTomD_OG @TomChivers @TomMcTague @TomPepinsky (lotta Toms) @juliaflynch @simonjhix @jrhopkin @CatherineDVries @lucycbarnes @ThatSaraGoodman @duncanrobinson @sundersays
And thanks go to @UniofOxford for financial support for the project through the John Fell Fund. And to my fantastic colleagues @jrgingrich @Jackstilgoe and Martin Bauer plus the team at @YouGov
• • •
Missing some Tweet in this thread? You can try to
force a refresh


