🇬🇧🇪🇺 Who caused Hard Brexit? Some thoughts from the perspective of a social scientist. In the last few days we have seen an interminable debate on whether Remainers, Soft Brexiters, or Hard Brexiters are responsible for Hard Brexit. And it’s a false debate. Why? 1/n
People are confusing 'causes of effects' with 'effects of causes'. What this means is that we are all interested in - the former - why Hard Brexit happened - but using arguments about how one actor did something - the latter - as our explanation. These are different! 2/n
It is completely possible that Remainers not accepting a customs union increased the probability of Hard Brexit - that's an effect of a cause. But that does not imply responsibility. Because there are lots of other causes producing the same effect. 3/n
When most of us think about 'responsibility' we have clear lines of cause and effect. This one person did this one thing thus they are responsible. But with Brexit we have lots and lots of actors doing lots of things and we have ended up at this one historical moment. 4/n
So Boris choosing one of his letters; May wanting to end free movement; SNP/Lib Dems/ChangeUK (remember them?) not voting for customs union; they all contributed to a higher probability of Hard Brexit. But it's all so fantastically contingent that we can't pick out one. 5/n
Since we can't choose one single 'cause' of the 'effect' of Brexit then this is not a typical whodunnit? This is Murder on the Orient Express. The whole exercise of finding a single event to blame is pointless. 6/n
Let me give a quick example. During the indicative votes farrago I was at Parliament advising MPs on voting rules. And it quickly became obvious that no rule would work because there was not even agreement on voting rules. In that scenario it's pointless to attribute blame. 7/n
We could argue LDs should have voted for customs union but we could also argue govt ministers should have voted at all, or that seeing Hard Brexit down the path Soft Brexiting Tories should have voted for a ref. But no option even had approval among MPs let alone 1st place! 8/n
So, if a PhD student came to me and said "my thesis explains why Hard Brexit happened" I'd say, frankly that's not a viable thesis. Too many different paths lead to the same outcome - a process we call equifinality. 9/n
So the whole exercise of 'who is responsible' for the causal process of Brexit occurring is basically unanswerable - at least in any simple way. Much better is to follow @Dannythefink and say "if you advocated it, you are responsible" 10/n
In other words, let's not think of responsibility as a causal process that we can't possibly resolve. Let's view it as epistemic responsibility - if you advocate an idea or a solution then you take some responsibility for how it turns out. 11/n
Brexit proper hasn't happened yet and frankly I have no certainty at all about how it will turn out (I can guess but...). So if it turns out well its advocates should get the credit and if it turns out badly the blame. Simple right? n/n
🧑🎓MERITOCRACY IN THE NEWS👩🎓 @David_Goodhart and Michael Sandel have both written provocative new books about the trouble with 'meritocracy'. Both argue that non-graduates have been undervalued and that graduates in non-graduate jobs are disillusioned. What do the data show? 🧵1/n
The former question is a tough one since there are two issues at stake. 1. Are non-grads elected as politicians? And 2. Are their policy preferences represented? But consensus in polisci is the answers are (a) Not as much as they used to be and (b) Not as much as for the rich.2/n
😷Social Distancing in the UK Update😷 Now with ANIMATIONS🎥Last week (see below) I looked at Google Community Reports on changes in workplace (& other) activity across British regions. I now have an extra week of data & income measures at the regional level. What do we see? 1/n
First off, the Brexit relationship was still there on April 9th (see below) - workplace activity has declined more in 'Remain' areas. The big question is why and I very deliberately was careful about that. Maybe it's because these areas are richer and people work from home? 2/n
We can have a look at that pattern in the figure below, which plots GDP per capita (i.e. personal income) at the local level versus changes in workplace activity from the norm for April 9th. Definitely some (negative) relationship but looks weaker than the 'political' one. 3/n
🚨 Where are people social distancing in the UK?🚨 Thanks to the Google Community Reports we can see how people have behaved since March. Good news - social distancing is happening everywhere. Less good news - there is still a divide. And guess what explains it... BREXIT...😬 1/n
The brilliant people at the ONS Data Science Campus have scraped the Google Community Reports and matched them to demographic and regional data. All I have done is further match this to the 2016 referendum vote at the local authority or county level. github.com/datasciencecam… 2/n
Now slightly annoyingly, Google collect activity data at differing levels - sometimes local authority, sometimes county, and just Greater London... But still we can see how demographics and (maybe) politics shape behaviour. And we'll see the culture war wins out... 3/n
🚨The problems with democracy coding and bias 🚨 Political scientists among you will know about the Polity IV score. This has been until recently the preferred measure of democracy for many scholars. So why, you may ask, does it not like democracy in US or UK? 1/n
Until quite recently - I'll let you guess the year - Britain and the US were coded as +10 on the Polity score. That's the max in a -10 to +10 scale. Same as Sweden, Germany, Spain, Portugal, Poland, Hungary... 2/n
Polity is made up of 3 components: constraints on the executive, recruitment of the executive, and political competition. The former is checks & balances, middle is how leaders are chosen, and latter is about elections and party competition. Final index comprised of all 3. 3/n
Are you a fan of parallel universes? Want to boost Boris, or save Jez? If so you may enjoy my GE2019 Resimulator. I've taken the results for the UK (ex NI) and plugged them into an election simulator where you can adjust polls from their actual numbers.1/n livedataoxford.shinyapps.io/GE2019_Resimul…
With a uniform national swing on 2019 it's fairly obvious how hard it would have been for the Conservatives to lose majority. Their lead over Labour would have had to collapse to 5 points - lower than almost any polling. 2/n
And for Lib Dems to make even 20 seats they would have needed an extra two point swing from Conservatives. To deprive them of a majority would have required a full six point LD/Con swing. 3/n
🚨🚨ELECTIONS AND HOUSING UPDATE 🚨🚨
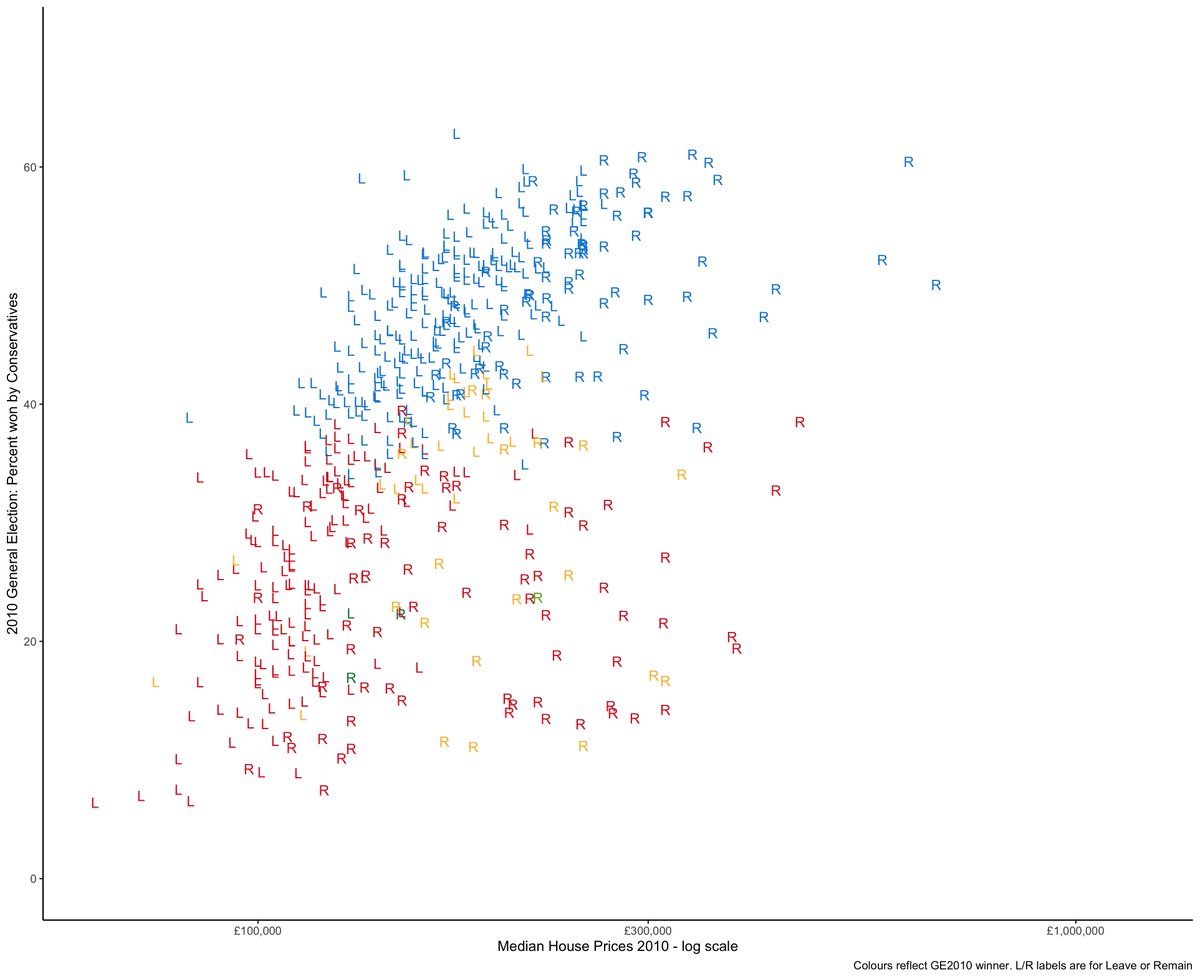
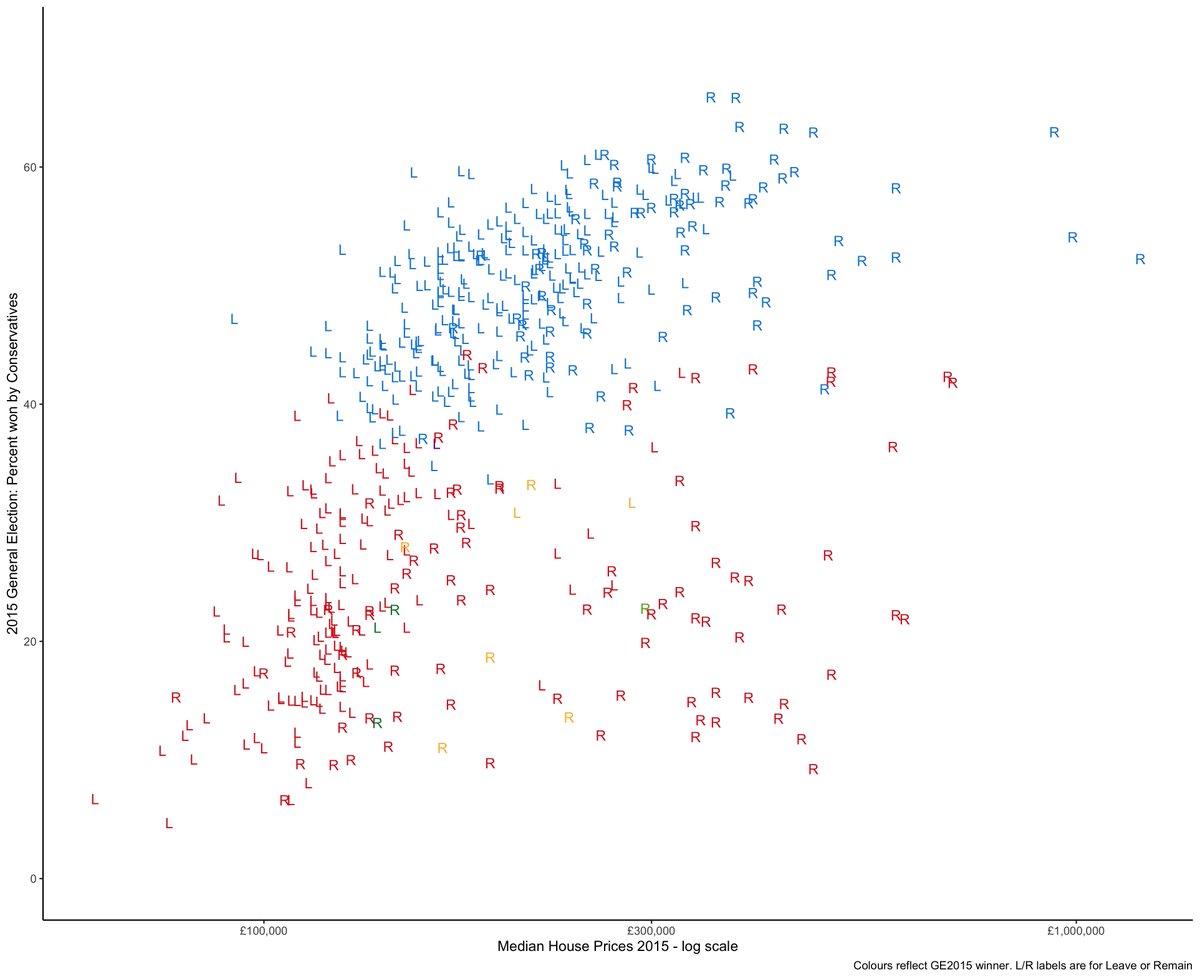
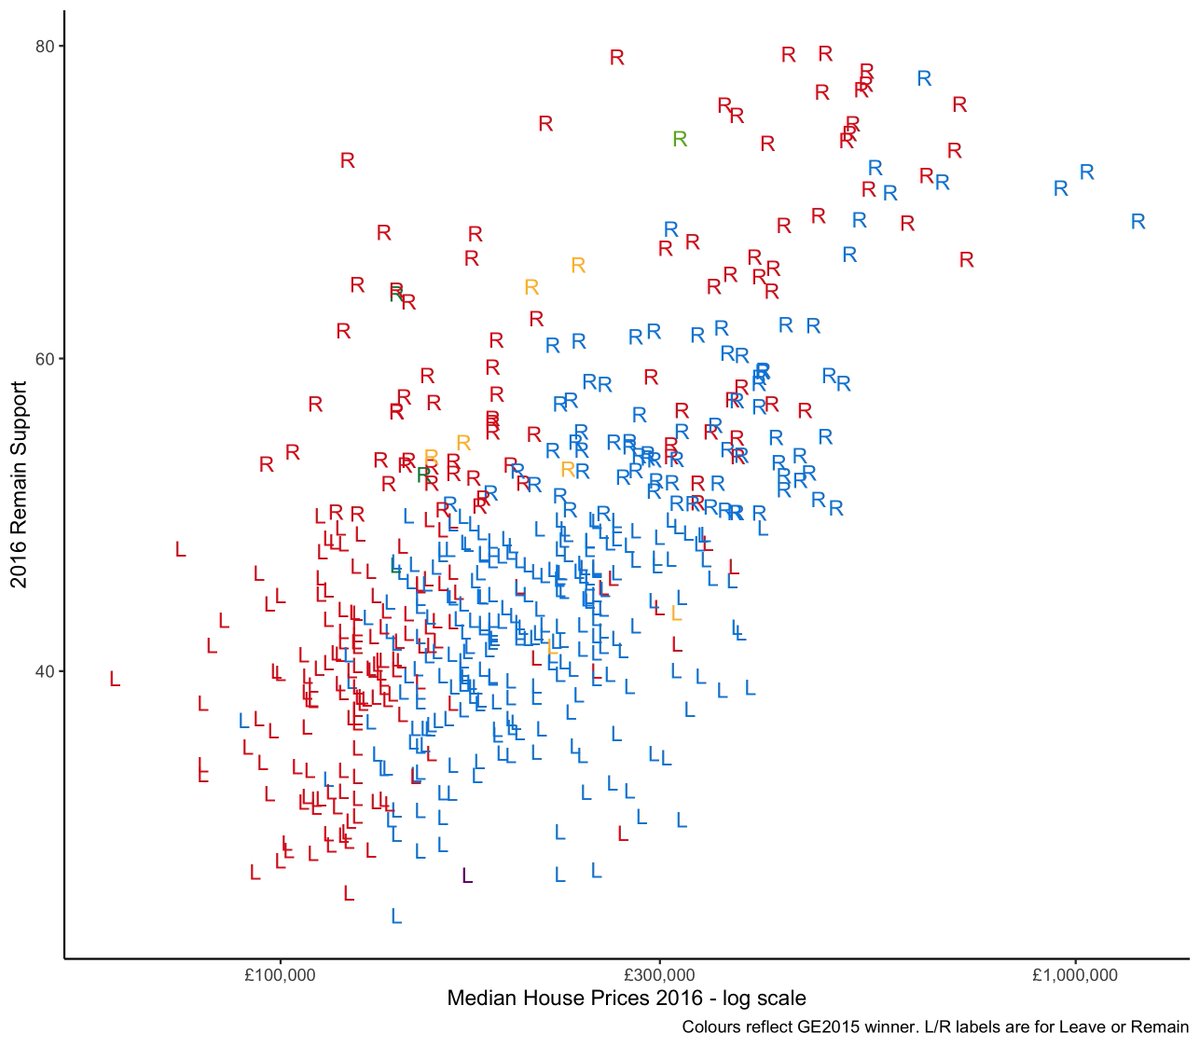
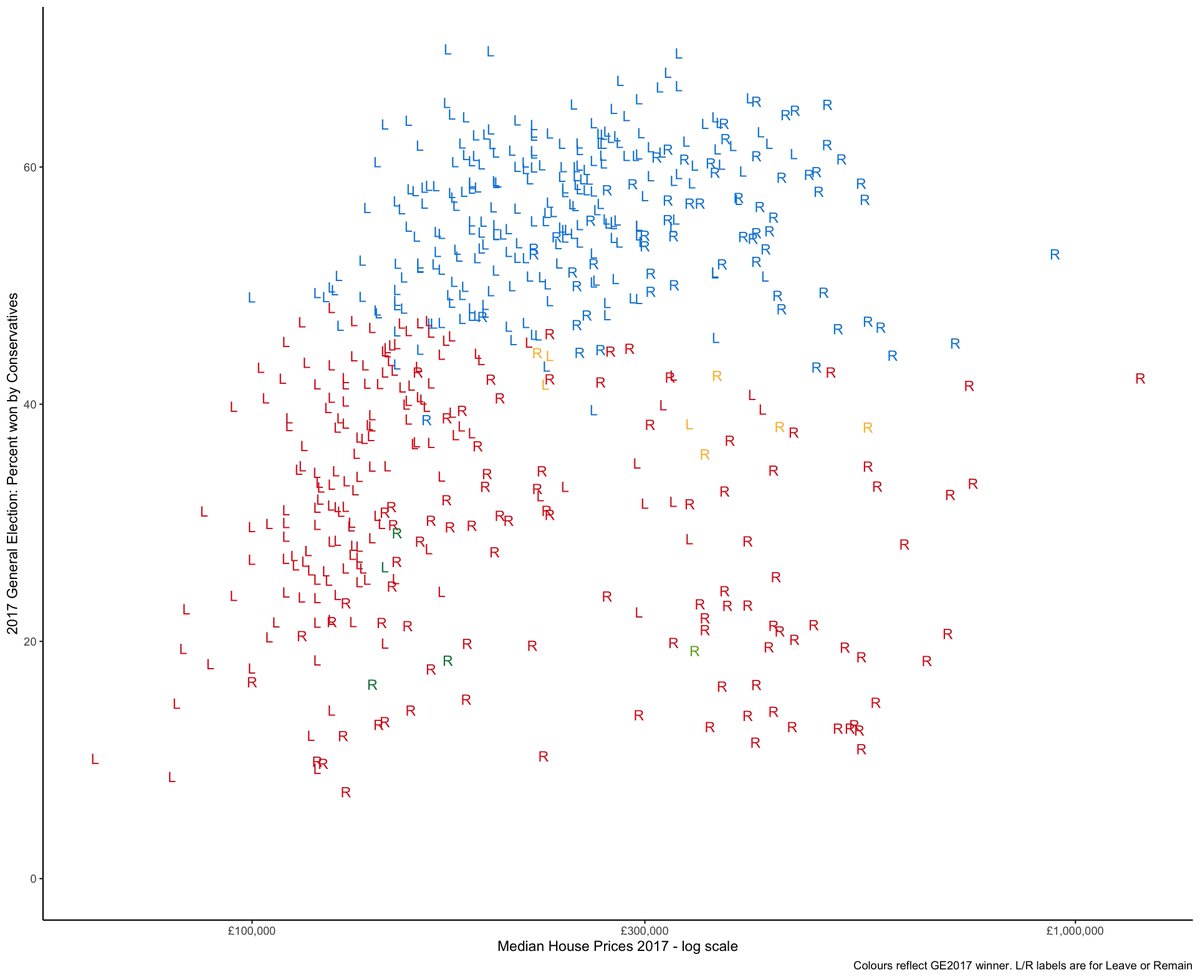
Regular readers know my obsession with the decline of house prices in predicting General Elections but their important role in predicting Brexit vote. So what happened in 2019? The connection between house prices and Tory vote was severed 1/n
In a piece for @anandMenon1@UKandEU I argued that the close connection between local wealth measured by house prices and the Tory vote had declined since 2010. And the reason was Brexit as a cross-cutting issue. 2/n
@anandMenon1@UKandEU Briefly, places with higher house prices used to vote Tory but also voted Remain in 2016. Two patterns cut across one another and meant house prices became less predictive in 2017. You can see that here in the following graphs 3/n