Did some prep for a workshop and upcoming talks around benchmarks and #nonprofit #email #fundraising in particular. Here's some of what I found.... this thread is for you #fundraisingtwitter... 1/
Online giving was up 21% in 2020 according to @blackbaud's Charitable Giving Report (institute.blackbaud.com/charitable-giv…) and broke through to be 13% of all giving 2/ 

Remember that % from online isn't a great way to measure the impact of digital. If a donor gets an email, sells stock w/ @Wealthsimple, moves it into their DAF w/ @VC_Giving & wires it to your bank this 'digital only' experience inspired by your email won't be 'online' 3/
And we've seen that an offline-only donor who just gets email (not even opens or clicks them) gives 84% more than offline-only donors who don't get email. Channels influence other channels so always keep that in mind with channel analsysi 4/ 

Okay, back to benchmark. In
@NextAfter_'s benchmark cohort, online giving was up 30%, every month was up YoY April onward and look at December! Up 118% YoY! 5/
@NextAfter_'s benchmark cohort, online giving was up 30%, every month was up YoY April onward and look at December! Up 118% YoY! 5/

A big reason for that was because email as a channel was up 77% in 2020 in our cohort. That was fueled by a 42%⬆️ conversion rate, 18%⬆️ in average gift. 6/ 

And, according to @NextAfter_ 's 3 Essential Metrics study in 2019 (nextafter.com/studies/3-esse…) email is THE biggest channel driver of ALL online revenue besides the often mistagged "direct" 7/ 

In @MRCampaigns benchmark (which is great) they found that email accounted for 16% of online revenue in 2019 (down from 18% in 2018). FWIW, @NextAfter_'s was 24% in 2018. 8/ 

Generally speaking (big caveats here) the more emails you have the more money you raise online. See this from @blackbaud's 2019 Luminate Benchmark Report (hi.blackbaud.com/luminate/) 9/ 

Again, email influences giving as well as being a great direct response channel for online, in fact, the highest conversion channel in our benchmark (160% higher than the next highest) 10/ 

Conversion rate by channel (% of traffic from email that make a gift) is NOT the same as response rate per email (% of email recipients who give from that email)! @blackbaud's Luminate Benchmark Report has that at 0.04% & @MRCampaigns Benchmark at 0.05% 11/ 


And when you look at engagement metrics (opens and clicks), fundraising emails are generally less than other types of emails (@MRCampaigns: mrbenchmarks.com) /12 

So keep that in mind if you look at other benchmarks like @Mailchimp's (mailchimp.com/resources/emai…) /13 

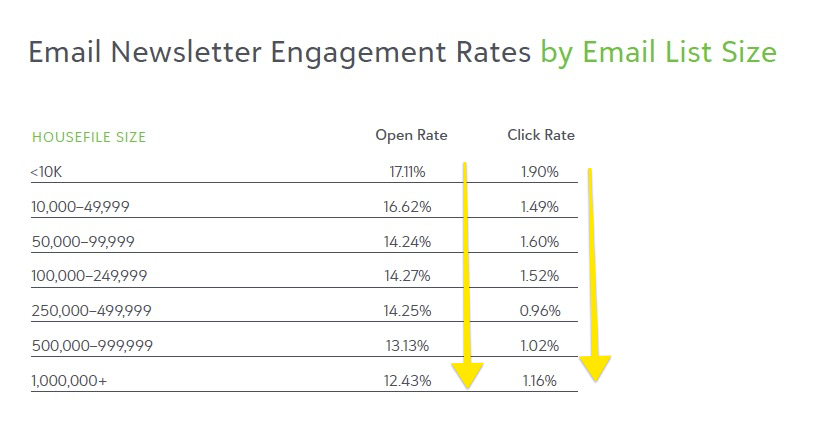
And also keep in mind that the smaller your email list/file is, the better your engagement rates are (@blackbaud) /14 

And that your first emails — like in a welcome series — are often even more read and engaged according to @blackbaud 15/ 

And we've seen even bigger increases in engagement, donations, and a reduction in unsubscribed when the welcome series is less 'get to know us' and more 'here's great content': app.winstonknows.com/e/DG5w 17/
Speaking of unsubscribes... they're gonna happen and the best way to avoid them is to optimize for engagement (not unsubscribe avoidance). @MRCampaigns found that 20% of emails drop off because of bounces (9.7%) and unsubscribe (10%) 18/ 

Which is why focusing on email growth is key. @blackbaud's 2019 Luminate Benchmark Report found email lists grew 8% with smaller files seeing smaller growth 19/ 

But @MRCampaigns saw a 2% decrease in list growth in 2019 after growth of 8% and 6% in the previous 2 years 20/ 

How many emails you send is a factor in unsubscribes (@Mailchimp's benchmark for #nonprofits was 0.2%/email) BUT generally speaking not sending emails for a long period of time OR ONLY asking for money are much bigger causes of unsubscribes and SPAM than 'too many emails' /21
FWIW, @MRCampaigns found the median (middle) organization sent 5.7 emails a month 22/ 

When we tracked emails for 90 days in 9 countries for a project with @SalesforceOrg, we found that the US sends way more emails than other countries each month to subscribers AND donors /23 


And we know email volume isn't linear but spikes around campaigns and giving days. Checkout the email volume spikes we observed on #givingtuesdaynow, #givingtuesday, and #yearend 24/ 

And the ratio of cultivation emails (goal isn't to ask for money) to solicitation emails (goal is to ask for money) is key. In a study we did with @kindfulapp looking at emails over 45 days after signup/donation here's what we found 25/ 


Okay, I gotta get on with my day but a few other interesting metrics you can use to look at your email performance. Revenue per 1,000 Emails Sent, @MRCampaigns tracks this and the overall average was $45 26/ 

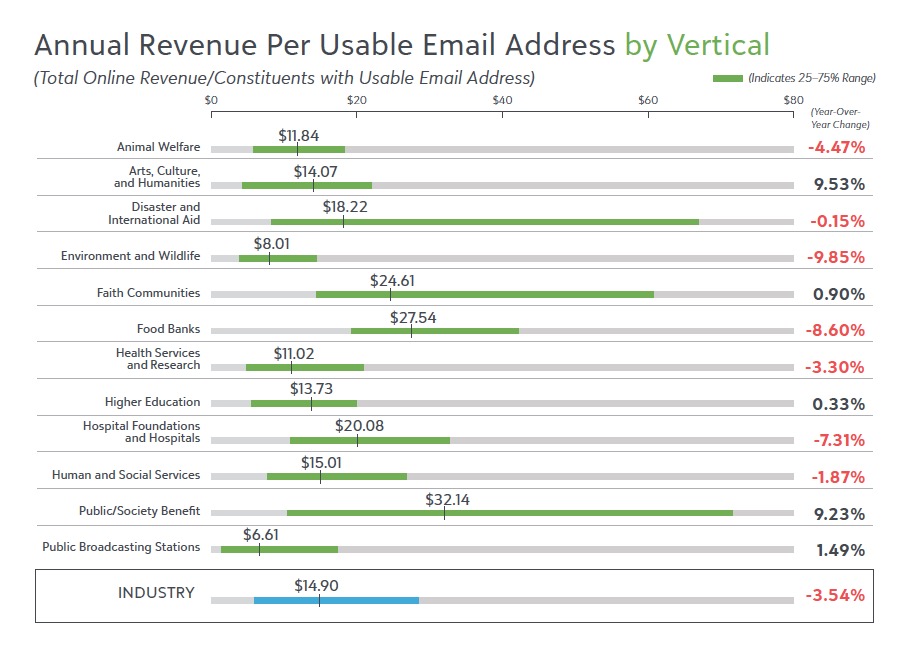
And @blackbaud's Luminate Benchmark Report looks at Revenue per Usable Email with an overall average of $14.90 27/ 

Alright, hopefully something in there helps and was useful. Here are sources I go to for #EmailMarketing #nonprofit #benchmarks:
@MRCampaigns: mrbenchmarks.com
@blackbaud: hi.blackbaud.com/luminate/
@Mailchimp: mailchimp.com/resources/emai…
@NextAfter_: nextafter.com/resources/
@MRCampaigns: mrbenchmarks.com
@blackbaud: hi.blackbaud.com/luminate/
@Mailchimp: mailchimp.com/resources/emai…
@NextAfter_: nextafter.com/resources/
• • •
Missing some Tweet in this thread? You can try to
force a refresh


