Nimblr Profile picture
26 Feb, 6 tweets, 3 min read
USDINR 73.7090 Starts its new upward journey. It has pierced above the previous bottom/low and would head to even 80-81 in a year.
.
Daily Chart
.
1/n
USDINR Daily Line Chart
.
2/n
USDINR Weekly Chart
.
3/n
USDINR Weekly Line Chart
.
4/n
USDINR Monthly Chart
.
5/n
@mbk28134171 @modiraj15 @Durga2b4
USDINR Monthly Line Chart
.
6/n

• • •

Missing some Tweet in this thread? You can try to force a refresh
 

Keep Current with Nimblr

Nimblr Profile picture

Stay in touch and get notified when new unrolls are available from this author!

Read all threads

This Thread may be Removed Anytime!

PDF

Twitter may remove this content at anytime! Save it as PDF for later use!

Try unrolling a thread yourself!

how to unroll video
  1. Follow @ThreadReaderApp to mention us!

  2. From a Twitter thread mention us with a keyword "unroll"
@threadreaderapp unroll

Practice here first or read more on our help page!

More from @Deishma

25 Feb
US Govt. 10yr Bond Yield jumped leading to rising bond yields.
.
1/4
The rising bond yields impact negatively the Tech Companies who borrow money heavily to fuel their growth.
.
2/4
That has been the reason for the tech-heavy Nasdaq Index to a sell-off since last two weeks
.
3/4
Read 5 tweets
14 Feb
Master-piece of a set up on 1minute that we at Intern Programme traded
.
Controlled the Trade to make the Final Bonanza.
.
Do go through the stages of an Impulse.
.
1/n
and its various stages
.
2/n
शिकार की खोज
.
3/n
Read 8 tweets
28 Oct 20
Morning Interns 5 Batch was askeed to wait for pink shaded area for Lower Low
.
And the trail of messages since then.
.
1/4 Image
2/4 Image
3/4 Image
Read 4 tweets
26 Aug 20
The Power & Craft of an Investor in riding the Sentiment Wave of an Index is much higher than the Power of Compounding.
.
1/n
You can make much money if you Sell at a High and Buy when the market is bleeding than holding to your stocks in the approach of compounding.
.
2/n
You may just be bitten by the Bug of Compounding to excuse yourself for not riding the Wave.
.
3/n
Read 4 tweets
16 Aug 20
BankNifty Fut Weekly Chart
.
Observe the darker thicker line at 21000 level providing support.
.
1/n Image
It is also low of week closing 13Mar20 as you can see on extreme left circled.
.
2/n Image
Last few weeks since 20June20 it is taking support on 21000 on Weekly basis with notable lows of 21025 and 21087 as seen in Value Chart presented as above.
.
3/n Image
Read 7 tweets
11 Jul 20
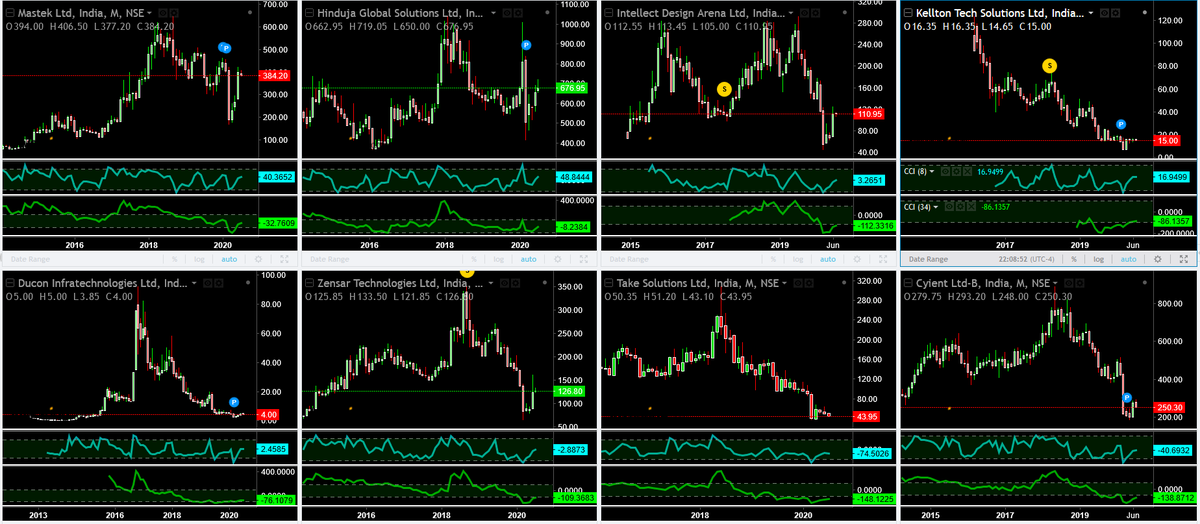
Software Stocks Monthly Charts
.
Sonata 233.25
Sasken 465.35
Mphasis 919.15
Nuclues 273.30
Majesco 360.05
L&T Tech 1411.70
L&T Infotech 2109.65
Tata Elxsi 928.50
.
Which could Top the List 2 years from now on Investing Returns?
.
11July20 7:33
#Software #Stocks Monthly Charts
.
#Mastek 384.20
#Hinduja Global 676.95
#Intellect Design 110.95
#Kellton 15.00
#Cyient 250.30
#TakeSolutions 43.95
#Zensar Tech 126.80
#Ducon Infratechnologies 4.00
.
Stocks to avoid totally.
Which could they be?
.
11July20 7:44
Software Stocks Monthly Chart
.
#TCS 2222.35
#HCL Tech 582.25
#NIIT Tech 1592.90
#Wipro 222.10
#Oracle #OFSS 2769.00
#MindTree 1007.95
#TechMah 569.00
#Infosys 781.85
.
Which stock could fall back behind in the Race?
.
11July20 7:51
Read 4 tweets

Did Thread Reader help you today?

Support us! We are indie developers!


This site is made by just two indie developers on a laptop doing marketing, support and development! Read more about the story.

Become a Premium Member ($3/month or $30/year) and get exclusive features!

Become Premium

Too expensive? Make a small donation by buying us coffee ($5) or help with server cost ($10)

Donate via Paypal Become our Patreon

Thank you for your support!

Follow Us on Twitter!