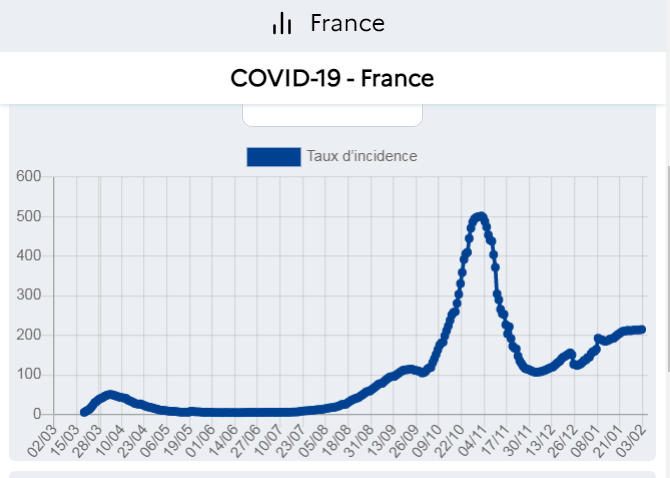
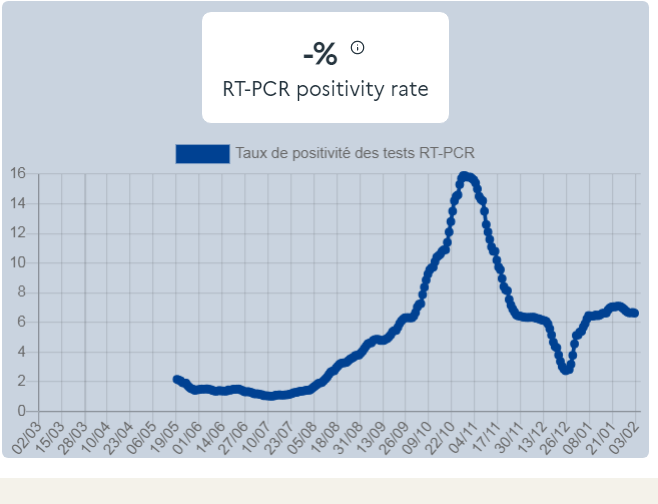
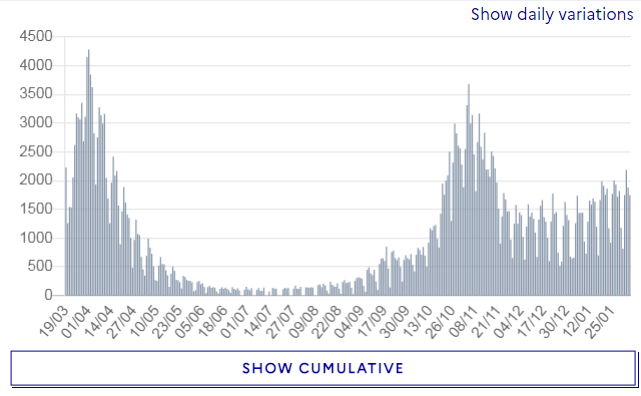
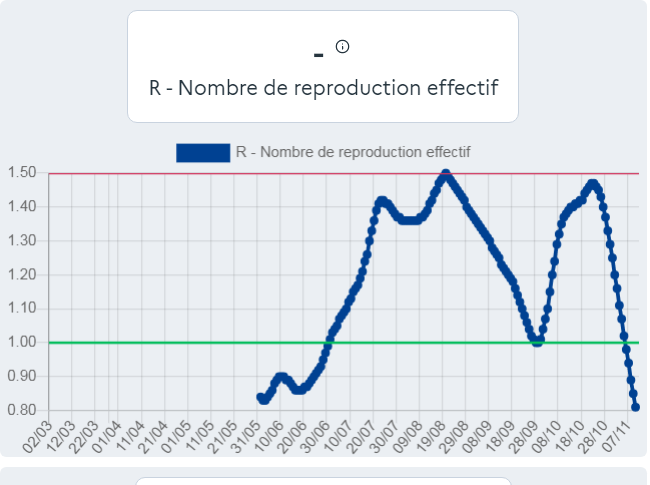
This slide from yesterday’s press conference is a bit naughty in my opinion.

It is clearly trying to imply that infections only fell after the start of 5 Jan national lockdown.

The problem is ...
... the graph does not show new infections (incidence) but the total number who would test positive at any one time (prevalence).

Incidence of new positive tests will have peaked earlier than prevalence & the peak of new infections will have been earlier still.
ONS modelled estimates actually place the prevalence peak at 1st Jan implying an infection peak probably even before Christmas.

That's a bit earlier than implied by other indicators (Zoe, actual positive tests etc.) but all show infections falling well before national lockdown.
Whether LD sped up the decrease or if it was caused by earlier tiers are separate questions but here's a reminder of all the indicators showing infections were falling well before national lockdown, even in regions that were not already in Tier 4. thecritic.co.uk/seven-indictor…
It is frustrating to see Govt scientists still seemingly try to present data to support a political message, i.e. that the January national lockdown caused infections to decrease. The data are clear it didn’t.

• • •

Missing some Tweet in this thread? You can try to force a refresh
 

Keep Current with David Paton

David Paton Profile picture

Stay in touch and get notified when new unrolls are available from this author!

Read all threads

This Thread may be Removed Anytime!

PDF

Twitter may remove this content at anytime! Save it as PDF for later use!

Try unrolling a thread yourself!

how to unroll video
  1. Follow @ThreadReaderApp to mention us!

  2. From a Twitter thread mention us with a keyword "unroll"
@threadreaderapp unroll

Practice here first or read more on our help page!

More from @cricketwyvern

21 Feb
Although cases have plummeted worldwide since Christmas, most countries in Europe have started to see increases (small so far) in past couple of weeks.

This is true in places with few restrictions (Sweden/Finland) as well as those with strict lockdowns (Denmark/Belgium/Austria).
Czechia is a good example: more or less in lockdown since mid-October though with quite a few specific tightening & relaxations at different times.

Restrictions ramped up even more on 30 Jan, yet cases are rising faster than in most countries. Here is the comparison with Sweden.
Not all countries have seen an increase, e.g.:

Portugal (lockdown) & Spain (no lockdown, varying regional restrictions): still seeing decreases.

Italy (restrictions but no lockdown & some recent relaxing) & France (significant restrictions, no lockdown): fairly stable for now.
Read 10 tweets
15 Feb
Two things stand out from the data & evidence:

1. When there is a surge in infections, cases eventually come down whether or not there is a lockdown/significant restrictions.
2. Lockdowns/many restrictions have little (not necessarily no) impact on hospitalisations & deaths.
Some find this hard to accept, as it seems so obvious:

Transmission comes from contact, restrictions reduce contact, so surely restrictions must reduce transmission & hence admissions & deaths?

But there are lots of reasons why restrictions may have less benefit than expected:
1. People change their behaviour voluntarily in response to changes in infections.

You choose to take less risk when infections surge, more risk when infections low, but just as importantly ...
Read 11 tweets
14 Feb
Restrictions were imposed to stop health services being overwhelmed.

Govt policy on reopening now seems to be based on an assumption that opening 1 thing inevitably increases transmission & so something else has to be kept shut.

There is little support for this in the data ...
E.g. A number of academic papers suggest opening schools has little or no impact on transmission rates:

academic.oup.com/cid/advance-ar…

medrxiv.org/content/10.110…

iza.org/publications/d…

So why should pubs stay shut longer because schools are open? Or retail or gyms?
The evidence of significant transmission from outdoor sports is v. weak, even contact sports like rugby: bjsm.bmj.com/content/early/…

So why should allowing sport be conditional on anything else?
Read 5 tweets
12 Feb
I think @ChrisGiles_ is basing his point on schools on the fact that prevalence is down more amongst school age children than 70+.

But if you look at the timing of the trends, I don't think the ONS data really scream out that closing schools reduces infections.
Changes in prevalence will reflect changes in infections about 2 weeks earlier. Take age 2-year 6 group (mainly primary). Estimated prevalence increased until a peak on 24 Dec (implying infections peaked about 10 Dec). So infections started falling at a time schools were open.
Prevalence falls until 6 Jan (i.e. infections about 23 Dec) & then increases again. i.e. infections in primary kids started increasing again when schools were shut for holidays.
Read 8 tweets
7 Feb
One reason I am sceptical about impact of Tier 3&4 is decline in infections from end-Dec is part of the normal longer run trend we see v. often: when cases rise, rate of growth increases, then declines & eventually goes negative. A bit like R declining but still > 1 for a while.
Here is rate of growth for Zoe estimates for England.

Growth rate turns -ve (i.e. estimated infections start to fall) on data from 3 Jan (implying infections falling perhaps 5-6 days earlier). But growth rate started falling from 16 Dec, i.e. before school hols or Tier 4.
V. little sign of tier changes/lockdown accelerating the trend. In fact, the inflection point around 23-28th Dec happens just when effect of school holidays/T3 then T4 in London/SE/E might have kicked in. Similarly, no sign of any accelerating of trend after lockdown.
Read 8 tweets
5 Feb
This is an interesting response by @cjsnowdon to @toadmeister but many of the examples he cites do not support his argument that infections start falling after lockdowns.

Here’s a closer look at 3 of them: France (31st Oct), Ireland (24th-31st Dec) & England (5th Nov)
1. France: 7-day cases were falling from 3rd Nov (not the 8th as @cjsnowdon states), positivity from 2nd, hospitalisations from the 5th. Given lag, these all show infections falling well before 31st October ...
France's estimated R-rate started falling from 24 Oct & there is no indication lockdown accelerated the decrease.

The 31st October French lockdown is not a good example of lockdown effectiveness.
Read 13 tweets

Did Thread Reader help you today?

Support us! We are indie developers!


This site is made by just two indie developers on a laptop doing marketing, support and development! Read more about the story.

Become a Premium Member ($3/month or $30/year) and get exclusive features!

Become Premium

Too expensive? Make a small donation by buying us coffee ($5) or help with server cost ($10)

Donate via Paypal Become our Patreon

Thank you for your support!

Follow Us on Twitter!