Time for the Monday @AltosResearch real estate market data thread!

This week - unseasonal seasonality!

1/7
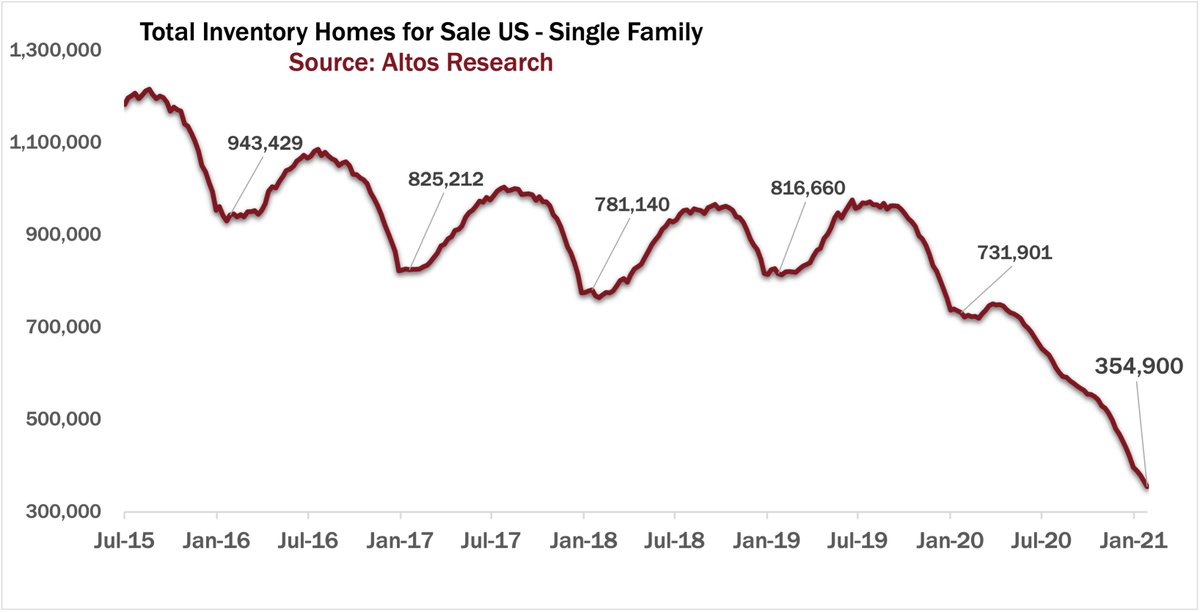
Available inventory drops again this week. We're at 325,000 single family homes on the market. No trough in site yet. We've just had no signs of normal seasonal patterns this year.

2/7
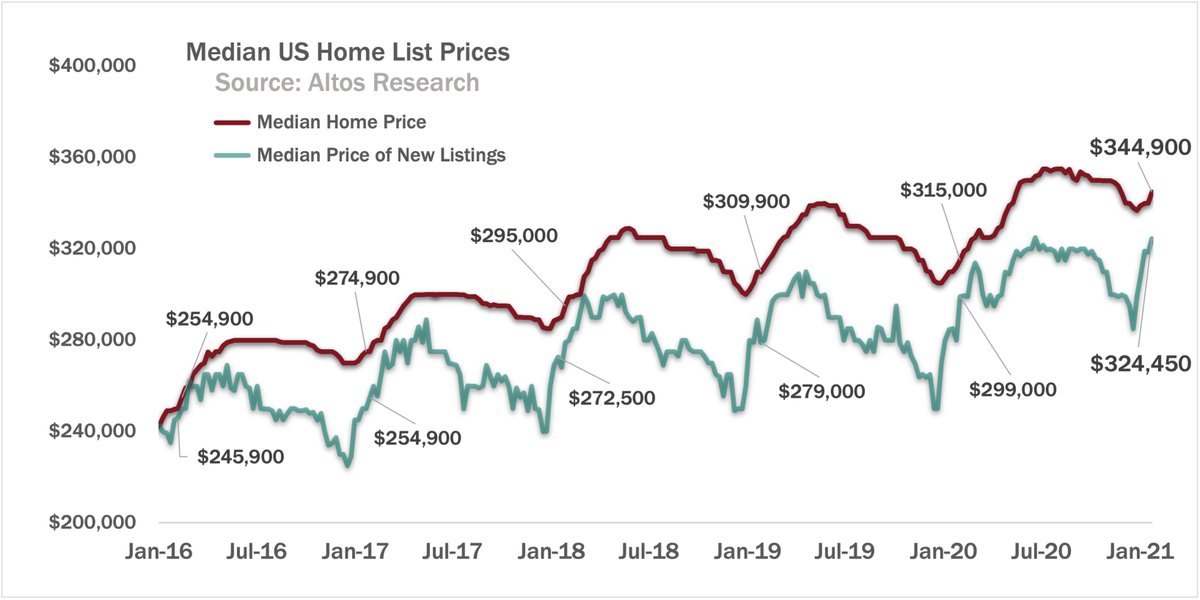
The leading indicator prices of the newly listed cohort shot way up again this week. The gray-green line is where you see the market pricing adjusting in real-time to off-the-charts demand. These new listings will be transactions that close at higher prices in the future.
3/7
We use median days on market to show how the winter season took no break. Market time for homes right now is already where the normal *peak* summer velocity would be.

All the seasonally adjusted numbers are going to print surprisingly big headlines in the next few months.

4/7
All the details in this week's video.


5/7
Lots of media this week. If you missed it, and are interested in the inventory crisis phenomenon, this piece in the NY Times Friday is really strong. nytimes.com/2021/02/26/ups…

6/7
Also, if you're a subscriber to @InmanNews check out this piece I wrote for them, published Saturday. I tried to be explicit about how we got here and where we're going.

7/7

inman.com/2021/02/27/wha…

• • •

Missing some Tweet in this thread? You can try to force a refresh
 

Keep Current with Mike Simonsen 🐉

Mike Simonsen 🐉 Profile picture

Stay in touch and get notified when new unrolls are available from this author!

Read all threads

This Thread may be Removed Anytime!

PDF

Twitter may remove this content at anytime! Save it as PDF for later use!

Try unrolling a thread yourself!

how to unroll video
  1. Follow @ThreadReaderApp to mention us!

  2. From a Twitter thread mention us with a keyword "unroll"
@threadreaderapp unroll

Practice here first or read more on our help page!

More from @mikesimonsen

15 Feb
It's Monday so here's this week's AltosResearch.com Real Estate Inventory Crisis update!

1/5
Inventory drops another couple percent this week. Only 344,000 houses on the market *in the whole country*.

No bottom in sight yet. Thousands of homes going directly into contract bypassing the active inventory numbers altogether.

2/5
Prices are up 10% year over year. This massive price appreciation seems likely to continue for the whole year. Median home price in the US is $345,499 this week.

YoY price changes will jump in a month when the first 2020 lockdown comparisons kick in.

3/5
Read 6 tweets
8 Feb
It's Monday, so it's time for the weekly US real estate data from @AltosResearch

We'll start with the latest view of the Inventory Crisis we're in.

thread 1/6
Total active inventory plummets yet again. Down to 355,000 single family homes on the market. Properties are moving so fast there are another roughly 10,000 that bypassed the active market altogether, going straight into contract, spending essentially zero days on market.
2/6
Unsurprisingly, prices are climbing. Up to $344,900, we're well on our way to another 10% price appreciation year. Massive equity gains for all homeowners.

3/6
Read 6 tweets
18 Jan
It's Monday, so that means the latest real estate data from @AltosResearch and man the leading indicators are all aligning for another big year of home price appreciation.

1/5
On the inventory watch, we're down to just 389,000 single family homes on the market. Many new listings are getting offers so quickly they're bypassing our active market data and just going straight to pending-contract.
2/5
What's inventory going to look like throughout the year? Fingers crossed that we get a more seasonal pattern in listings this year, trough in a couple weeks at 370,000 or so, peak in 3Q at only 5670,000 or so. A million would be healthy/normal.

3/5
Read 5 tweets
4 Jan
First real estate data for the new year is in!

Available inventory is of course still the story. We're starting the year with just 419,000 homes one the market. Last year was 763,000. It wasn't that long ago when we'd start the year with 1 million or more active inventory.
1/5 Image
New Years' is always the lowest listing volume and this year we're at just 23,000 new listings. That'll jump this week. Fingers crossed that inventory follows a more normal pattern this year so we can meet some of the demand out there.
2/5 Image
US single family home prices ended 2020 up 10% over 2019. Unreal. Like all the booming financial markets, real estate remains unhindered by any pandemic negative impact. Keep an eye on the gray line here for the steep jump that'll happen next week.

3/5 Image
Read 5 tweets

Did Thread Reader help you today?

Support us! We are indie developers!


This site is made by just two indie developers on a laptop doing marketing, support and development! Read more about the story.

Become a Premium Member ($3/month or $30/year) and get exclusive features!

Become Premium

Too expensive? Make a small donation by buying us coffee ($5) or help with server cost ($10)

Donate via Paypal Become our Patreon

Thank you for your support!

Follow Us on Twitter!