The latest antibody data from @ONS shows levels continuing to increase, especially in older age groups now being vaccinated.

This data is for 15/1 to 11/2 - note that it takes 2-3 weeks for antibodies to form, so not all those jabbed recently will have tested positive.

1/6 Image
England increases to 23.3% (18.5% two weeks ago)
Wales: 16.4% (14.4%)
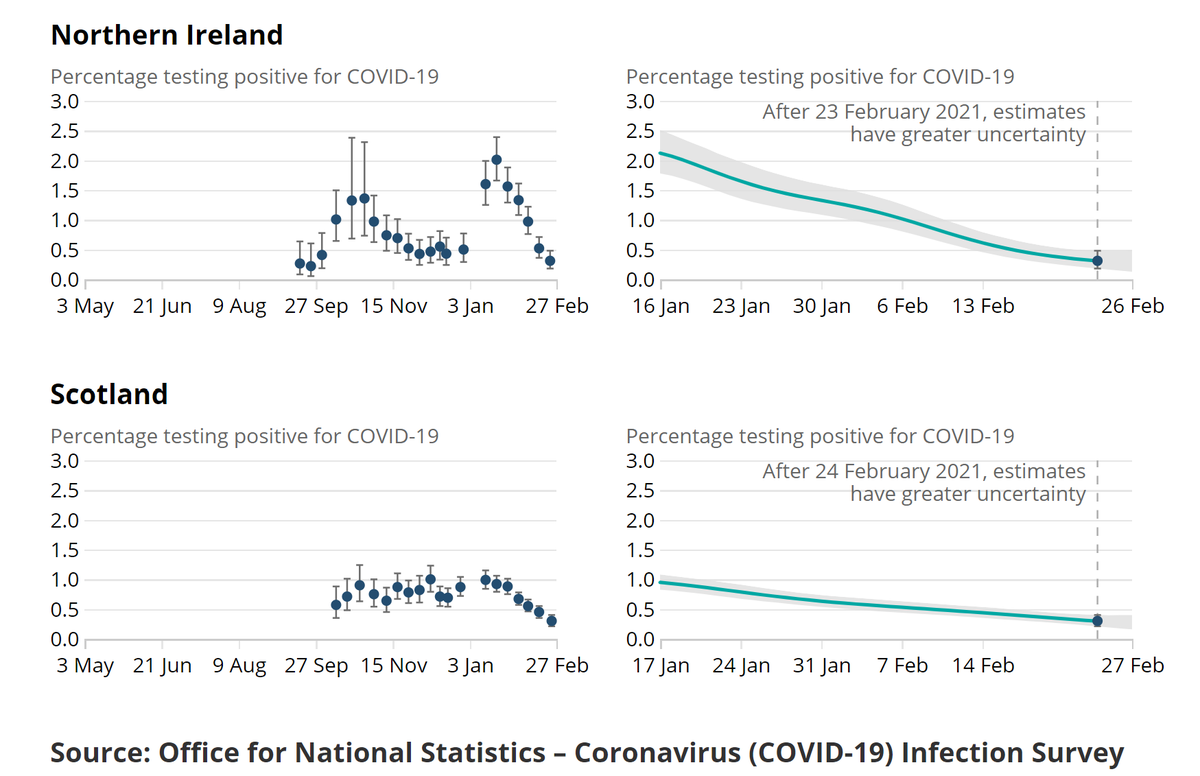
Scotland: 13.1% (11.7%)
N Ireland: 15.9% (13.6%)

The last survey was 5/1 to 1/2 - note the 4 week periods overlap.

2/6 Image
Look at the increase in Over 80s in England, up from 40.9% two weeks ago to 56.4%!

75-79 has doubled from 12.4% to 24.9% too.

The differential in the oldest age group is much less clear in other countries though.

3/6 Image
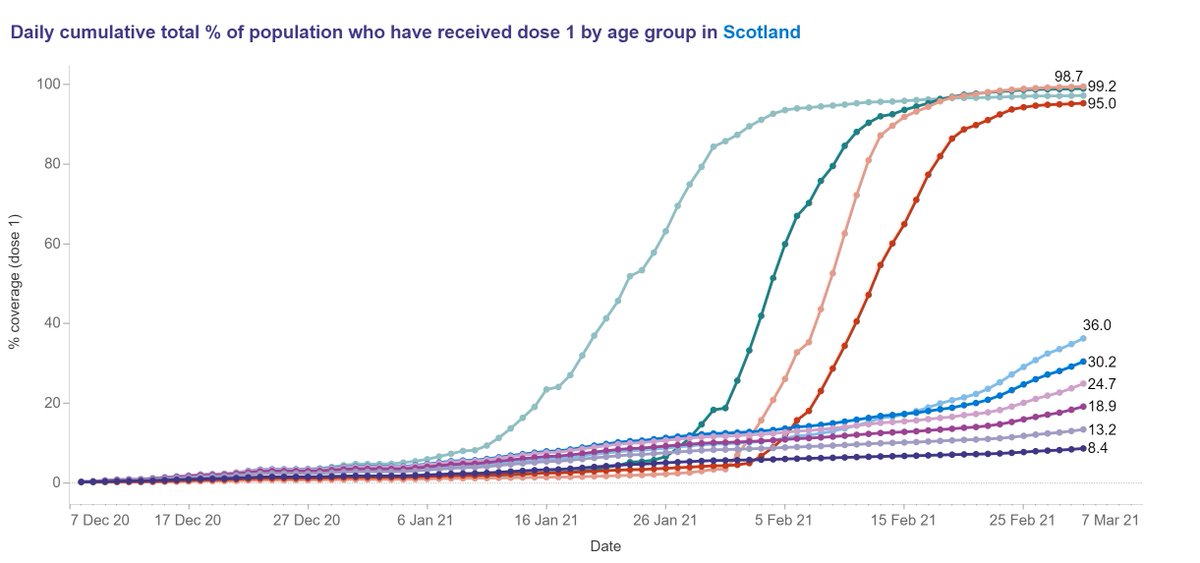
There's a really neat graphic that shows the build up over time by age group. Nice!

4/6 ImageImage
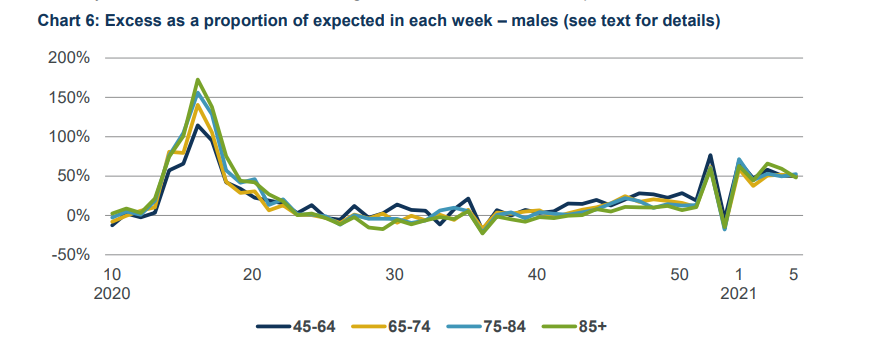
There's maybe a surprising differential by age group, with men lagging behind. It's across all age groups too, so not just a function of more women in the most elderly lives.

With the differential much higher at younger ages, maybe vaccinated care workers is one cause?

5/6 ImageImage
Note this is a community randomly sampled survey (so eg no Care Homes). The sample size in England was 30k for the 4 week period.

Thanks as ever to ONS and its partner organisations for this continuing fortnightly survey. ons.gov.uk/peoplepopulati…

6/6

• • •

Missing some Tweet in this thread? You can try to force a refresh
 

Keep Current with John Roberts

John Roberts Profile picture

Stay in touch and get notified when new unrolls are available from this author!

Read all threads

This Thread may be Removed Anytime!

PDF

Twitter may remove this content at anytime! Save it as PDF for later use!

Try unrolling a thread yourself!

how to unroll video
  1. Follow @ThreadReaderApp to mention us!

  2. From a Twitter thread mention us with a keyword "unroll"
@threadreaderapp unroll

Practice here first or read more on our help page!

More from @john_actuary

5 Mar
The latest ONS infectivity data suggests continued strong falls in infections across all four countries, with typically reductions of around a third in a week.
Starting with England, which falls from 0.69% to 0.45%, down 35%. That's now 1-220 of the community population.
1/8 Image
Wales falls by 27%, down from 0.48% to 0.35%, or 1-285 of the population.

Scotland is down from 0.45% to 0.30%, a 33% fall, or 1- 335.

Finally N Ireland falls by 40% from 0.52% to 0.31% or 1-325.

2/8 Image
Regionally most areas are falling although the ONS says that there is more uncertainty in the E Midlands, North East and East. The NE is now double the lowest areas.

3/8 Image
Read 8 tweets
4 Mar
Thu Vaccine Update
279k 1st doses, total now 20.98m.
68k 2nd doses, total now 964k.

1st doses are barely half last week, the 7 day total falls again to 2.3m.
2nd doses continue to reach new highs, with the 7 day total now 263k.

England data and ethnicity take-up next.

1/4 Image
England's weekly results show that the 65-69 range (Group 5) is approaching completion. Hopefully next week we'll also have data for 60 to 65 as this was opened up widely a few days ago.

This means we are now starting to vaccinate the working population.

2/4 Image
The weekly openSAFELY report still shows a wide take-up difference by ethnicity, weeks after groups should have been completed. For age 80+ the variation is between 94.5% down to 65.4%.

The range by deprivation is between 88% and 95%, so it's not just that causing it.

3/4 ImageImage
Read 4 tweets
4 Mar
,The latest #REACT study (Round 9b) on infectivity from @imperialcollege suggests continuing falls but at a slower rate in the second half of Feb, with R around 0.86 by the end of the period. (4th to 23rd Feb), having been 0.73 earlier a few weeks earlier.

A thread....

1/12 Image
Starting with the summary details.

Prevalence is put at 0.49% (0.44%, 0.55%) for Rd 9, although slightly lower in the second half at 0.47%. These rates are less than a third of those seen in Rd 8 just a month earlier. That's great news!

2/12 Image
The results suggest that R was around 0.73 during the fastest period of the fall (halving time 15 days), but has now eased off to 0.86 (31days), with notable regional variations causing the increase in R.

3/12 Image
Read 12 tweets
3 Mar
Wed vaccine update:
1st doses: 263k daily, 20.74m total.
2nd doses: 51k daily, 895k total.

1st doses are 20% down on last week, the 7 day total falls to 2.5m.

2nd doses reach a new high since deferred to 12 weeks, and the 7 day total is now 226k.

S/W/NI next...

1/4 Image
Scotland's dashboard now has some neat graphs, which show the total's vaccinated of each age-group, both in total, and with a build up over time.

A clear visual presentation, and great take-up rates too!

2/4 ImageImage
Meanwhile Wales has restated its take-up rates to exclude from the denominators those who have recently died, thus resulting in them increasing. eg Over 80s was 91.2% two days ago and is now 93.9%. This reduces the % not vaccinated by 30% in this age group.

3/4 Image
Read 4 tweets
16 Feb
The CMI has now published it's latest weekly analysis of COVID excess mortality on an age-standardised basis. It now estimates 104,600 excess deaths, with 42% in the second wave.

A few more observations follow below.

1/4
We can see how there has already been around 4% (of a full year's deaths) excess so far in 2021.

This graph, which compares a year with the previous one, will abruptly change direction in late March as 2020 worsened, but for now it helps show the quantum of variance.

2/4
We can see here that male mortality in all age groups over 45 has been around 50% higher than normal in recent weeks. COVID doesn't just affect the elderly or very sick.

3/4
Read 4 tweets
16 Feb
As reported on Saturday, the proportion of England hospital deaths over 80 has fallen below 50%, and the general trend is still clearly downwards, with some recent days around 46%.

Next I'll set out what that might mean, in terms of influencing the overall death figures.

1/4
If the prop'n falls from 56% to 50%, and there's no change for younger ages, then out of 100 deaths (split 56/44), it's now split 44/44. So that's a reduction of 21% in the over 80 deaths, and 12% overall.

(I've used 56% as that was the average before the mid Dec spike.)

2/4
This is broadly in line (maybe 3 or 4 days behind) with the expectation laid out in the paper recently published with @doctimcook.


So I think it is very clear now that we are seeing the vaccine effect in death figures.

3/4
Read 4 tweets

Did Thread Reader help you today?

Support us! We are indie developers!


This site is made by just two indie developers on a laptop doing marketing, support and development! Read more about the story.

Become a Premium Member ($3/month or $30/year) and get exclusive features!

Become Premium

Too expensive? Make a small donation by buying us coffee ($5) or help with server cost ($10)

Donate via Paypal Become our Patreon

Thank you for your support!

Follow Us on Twitter!