1/n A sizeable body of literature in the political sciences contends that female political candidates are disadvantaged by voter sexism. But, as @LJZigerell and I argue in a recent paper (linked in the final tweet), the measure of sexism on which this conclusion often rests..
2/n ...also shows that male candidates are penalized by a pro-women or anti-male bias. To explain, here is a version of the 'modern sexism' scale that is often featured in this line of research.
3/n The very title of the scale seems to imply (and is often interpreted as such) that it runs from 'non-sexist' at the low end to 'sexist' at the high end. But, as LJ and I point out, the scale actually appears to range from 'anti-male' to 'anti-female'.
4/n To demonstrate this, we made use of two gendered feeling thermometers that were included in the 2019 wave of the Democracy Fund's voter study group. We subtracted each respondent's ratings of (on a 0-100 scale) 'women' from their ratings of 'men'. We then assessed...
5/n the size of the differential across the range of the modern sexism scale. As you can see, those who scored 'lowest' on MS rated women ~25 points more warmly on average than men. In contrast, those who were 'mild' modern sexists' actually rated the two sexes equally warmly.
6/n There were also significantly significantly more respondents on the 'pro-female/anti-male' side of the warmth distribution (and, though not shown, on the MS distribution as well)
7/n To reiterate: one implication of this is that, if female candidates are penalized by anti-female/pro-male sentiment, male candidates are penalized by anti-male/pro-female sentiment. We try to demonstrate this below.
8/n And because anti-male/pro-female sentiment is more prevalent in the sample than the inverse, it could be argued that, in the aggregate, female candidates enjoy a net advantage.
9/n But the real thrust of the paper is our argument that, because it lacks both a neutral mid-point and a 'non-sexist' low-point, modern sexism shouldn't be treated or used as a valid measure of sexism.
10/n Some recent researchers have acknowledged this problem and have attempted to create an 'anti-male' version of the MS scale. A major problem with this is that it a) simply substitutes 'men' for 'women', and thus b) applies stereotypes of women..
11/n (e.g. 'women are much too easily offended by innocent remarks') to men, which would have the effect of understating anti-male sentiment (because the incongruency will elicit less agreement)
12/n While not flawless, we argue that the gendered feeling thermometers--because they have neutral midpoints and clearly defined end-points--are a better and more valid index of anti-female/male sentiment than the MS scale. We nonetheless encourage researchers to develop..
13/n ..alternative measures that address the flaws of the MS scale.
14/n Here is a link to the paper. dropbox.com/s/ybutw7w136df…
We're still in the pre-print phase, so we would greatly appreciate any feedback (in fact, that's more or less the point of this thread)

• • •

Missing some Tweet in this thread? You can try to force a refresh
 

Keep Current with Zach Goldberg

Zach Goldberg Profile picture

Stay in touch and get notified when new unrolls are available from this author!

Read all threads

This Thread may be Removed Anytime!

PDF

Twitter may remove this content at anytime! Save it as PDF for later use!

Try unrolling a thread yourself!

how to unroll video
  1. Follow @ThreadReaderApp to mention us!

  2. From a Twitter thread mention us with a keyword "unroll"
@threadreaderapp unroll

Practice here first or read more on our help page!

More from @ZachG932

23 Feb
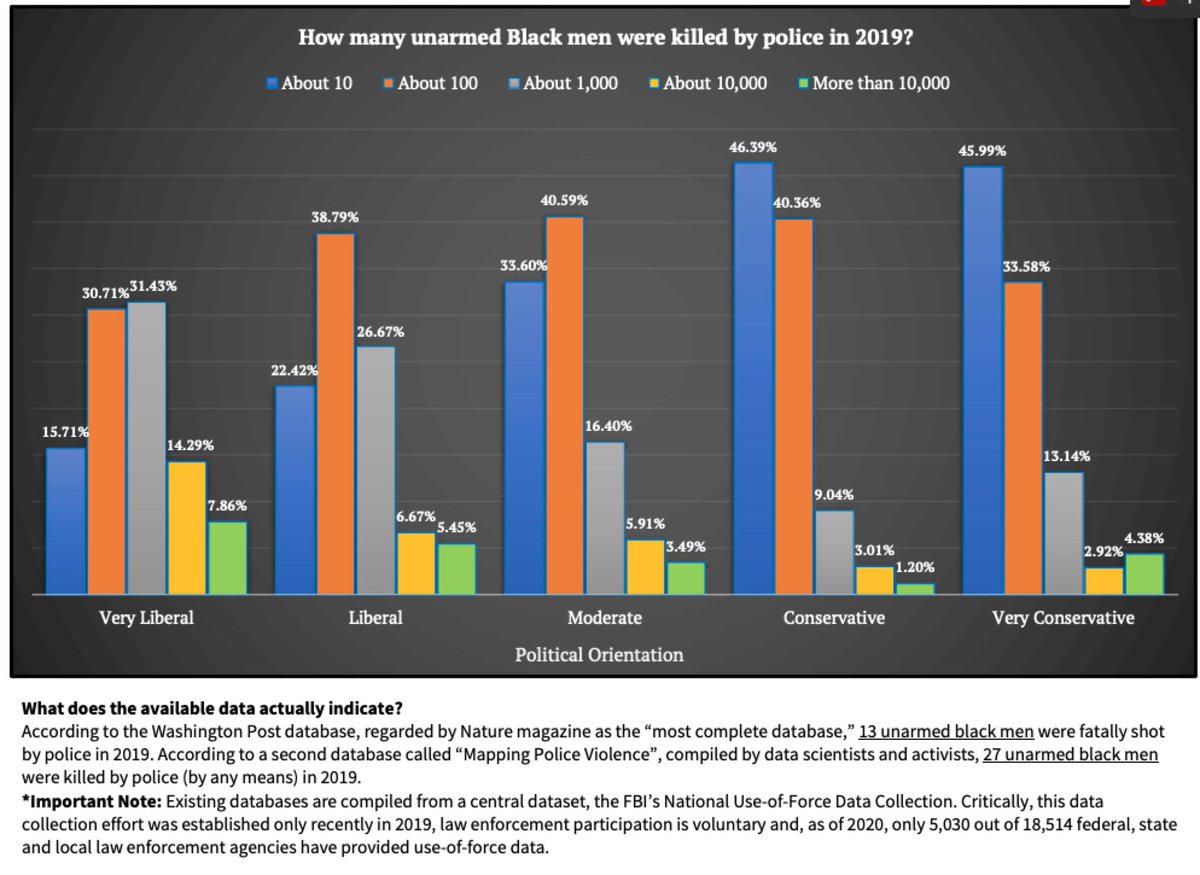
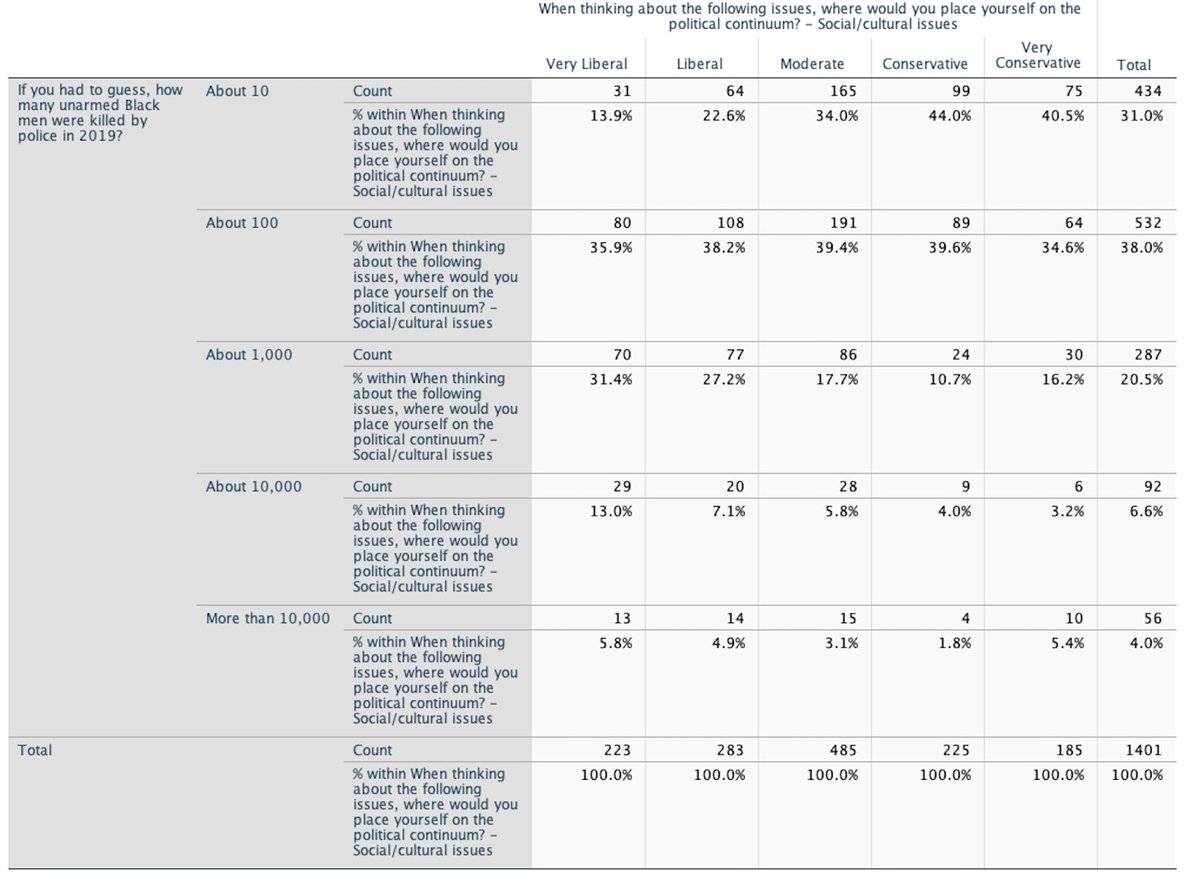
1/n A recent nationally representative survey commissioned by Skeptic Mag asked respondents to estimate the number of unarmed blacks killed by police in 2019. Overall, 44% of liberals guessed 1,000 or more as compared to 20% of conservatives (this calculation is based on the..
...cross-tabs shared with me by the researcher)
3/n According to the Mapping Police Violence database, the actual figure is 27.
Read 8 tweets
19 Feb
1/n The ANES hadn't asked this question since '08. It was finally included in the 2020 survey, though, so here's an updated chart
2/n In 1996, just under 9% of white liberals supported decreased spending on border security. This figure jumped to ~29% in 2008. It now sits at ~54%.
3/n Meanwhile, conservatives have hardly moved an inch (and this is generally the case in other measures of immigration policy attitudes I've looked at)
Read 7 tweets
31 Dec 20
1/n Recent paper presents evidence that research that reflects negatively on same-sex parenting is less likely to be cited. Would love to see more studies like this, particularly of the racial bias literature... europeansocietyofmedicine.org/index.php/imr/…
2/n We already have some evidence that studies finding no anti-black bias are less likely to be published journals.sagepub.com/doi/pdf/10.117…. And I suspect those demonstrating bias are also less likely to be cited than those that do.
3/n And this is just one reason why we should be skeptical of the 'consensus' @roderickgraham that likes to proclaim on questions of group differences
Read 4 tweets
25 Dec 20
1/n Spending Christmas working on my dissertation (because apart from eating Chinese, what else is a Jew supposed to do?). Here's a graph I'm including in the current chapter.
2/n Note that almost all of the change comes not from rating blacks more favorably/unfavorably, but from rating whites more favorably (conservatives)/unfavorably (liberals).
3/n Here's another plot for reverse-coded 'racial resentment' (which I'd argue is more of a measure of perceptions of discrimination and racial sympathy. In other data, it is much more strongly correlated with both white shame and guilt than feelings towards blacks).
Read 6 tweets
2 Dec 20
1/n To help promote @RichardHanania's fascinating new article(), I thought I'd thread graphs of some of the data I found interesting
2/n First, I found it interesting that even when both refugee groups were described as being likely to overwhelmingly vote democrat, white dem participants still favored admitting (unskilled) Venezuelan over Ukranian refugees by a 16.4 point margin (p=0.039). Image
3/n The inverse is true for republicans, who favor likely republican voting Ukranian to Venezuelan refugees by a 12.4 point margin (though the diff falls short of significance, p=0.104)
Read 10 tweets
7 Nov 20
1/n Suggestion: One of the advantages of a federalist system is it allows for 'policy experimentation'--new policies can be tested at the local or state-level. If those policies are deemed successful, other states can adopt and test them out in their own..
2/n contexts. Ultimately, this builds a body of evidence indicating whether a policy is likely to succeed (or fail) if implemented at the national level. Thus, Progressives who claim that only their policies can 'save us' should bolster their case by testing them and seeing..
3/n if they actually deliver the predicted results across a diverse set of cultural and economic contexts...lest they bring the entire country down with them.
Read 8 tweets

Did Thread Reader help you today?

Support us! We are indie developers!


This site is made by just two indie developers on a laptop doing marketing, support and development! Read more about the story.

Become a Premium Member ($3/month or $30/year) and get exclusive features!

Become Premium

Too expensive? Make a small donation by buying us coffee ($5) or help with server cost ($10)

Donate via Paypal Become our Patreon

Thank you for your support!

Follow Us on Twitter!