Phil Kerpen Profile picture
5 Mar, 21 tweets, 10 min read
Friday Fluday Thread, MMWR Week 8

Friendly reminder: Please remember who told you we'd skip flu season and who screamed twindemic!
United States Influenza testing, MMWR week 8.

CDC flu view. cdc.gov/flu/weekly/ind…

Five-year average: 9,724 cases; 25.10% positive

Last year: 12,402; 27.95%

This year: 33; 0.09%

docs.google.com/spreadsheets/d…
United States Influenza testing, season to date (22 weeks, MMWR 40 to 8)

Five-year average: 139,610 cases; 17.31% positive

Last year: 225,169; 22.29%

This year: 1,739; 0.17%
Season-to-date U. S. flu hospitalizations down 98.7% from last year, which was a typical year.

Flu hospitalizations total (22 weeks) in FluSurv-NET catchment is 193. Through week 8 last year (21 weeks) it was 15,319.

Rate last year: 52.7 per 100K
This year: 0.7 per 100K
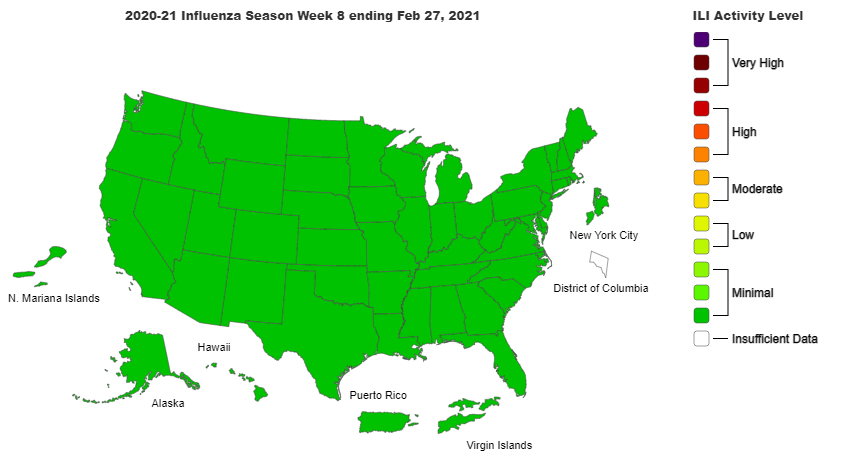
Influenza-Like Illness (ILI) continues to track well lower than the mild 2015-16 and 2011-12 seasons, and is now declining when it was rising in those years.
Still just one U.S. pediatric flu death this season. (There are 91 pediatric deaths with COVID this season.)
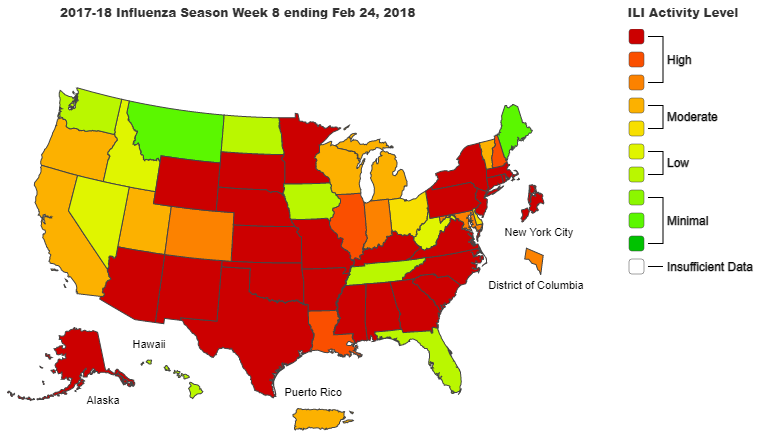
Influenza-Like Illness (ILI) Map

Week 8: 2021, 2020, 2019, 2018
Latest U.S. non-SARS-CoV2 syndromic data from BioFire. Lots of rhinoviruses. Some adenoviruses, and HCoV-OC43 and HCoV-NL63 comeback continues.
syndromictrends.com/metric/panel/r…
Florida. Schools open all year. No lockdowns since September. Rhinoviruses and some adenoviruses but nearly no flu. RSV rising toward normal levels.
floridahealth.gov/diseases-and-c…
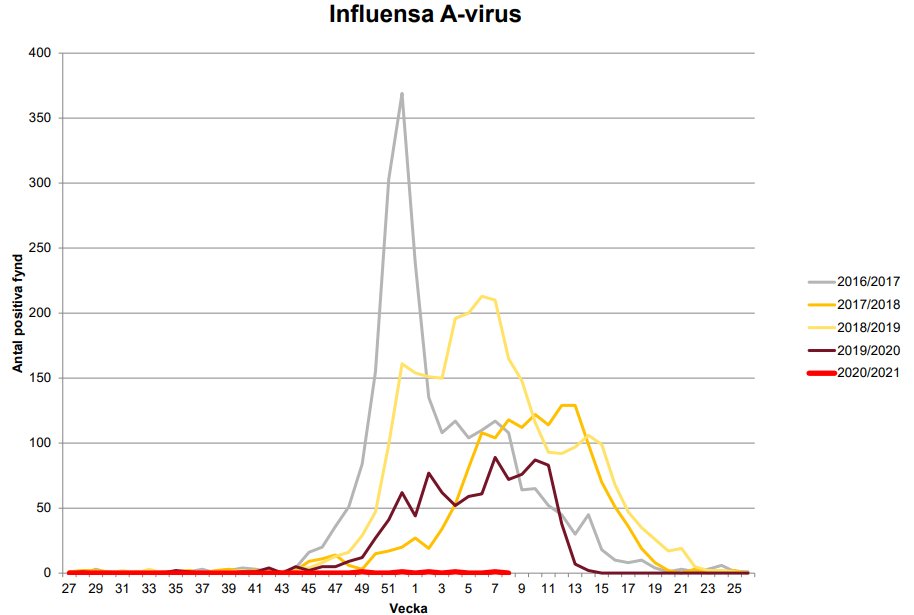
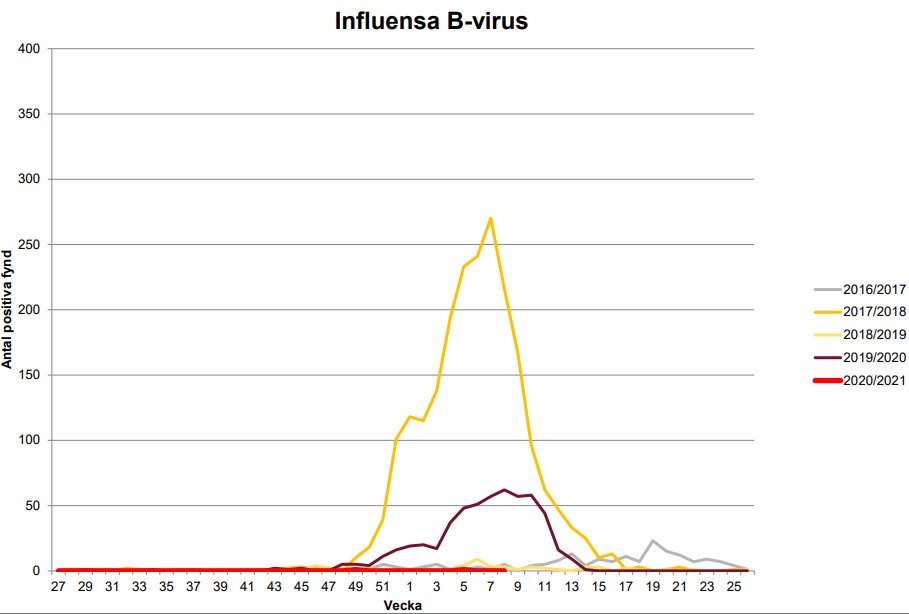
Sweden week 8. No masks, no lockdowns, no school closures -- and still no Flu A, Flu B, or RSV. HCoVs are now back and rising.
karolinska.se/globalassets/g…
The global flu chart from WHO.
apps.who.int/flumart/Defaul…
For the curious, Belarus completely skipped flu season this year.
apps.who.int/flumart/Defaul…
I don't think it's masks, which have been shown ineffective for stopping influenza in many, many studies.
Japan masked hard in 2019 and failed to stop a major flu outbreak. But in 2020 flu disappeared with low stringency COVID intervention.

The idea that mitigations worked but unmitigated SARS-CoV2 just has a higher R0 is too facile. Rhinoviruses bounced right back despite lower R0 and RSV was gone with comparable R0 to SARS-CoV2. HCoVs were gone until the last few weeks, when SARS-CoV2 declined.
Plus, as Biden adviser Dr. Michael Osterholm points out, our mitigation just hasn't been very effective. Maybe in places like Australia and New Zealand where mitigations stomped SARS-CoV2 they also stomped other viruses. But in countries where SARS-CoV2 went wild? No.
"There is this viral interference..."

This short article from @m_soond is still the best theory in my opinion.
medium.com/illumination-c…

• • •

Missing some Tweet in this thread? You can try to force a refresh
 

Keep Current with Phil Kerpen

Phil Kerpen Profile picture

Stay in touch and get notified when new unrolls are available from this author!

Read all threads

This Thread may be Removed Anytime!

PDF

Twitter may remove this content at anytime! Save it as PDF for later use!

Try unrolling a thread yourself!

how to unroll video
  1. Follow @ThreadReaderApp to mention us!

  2. From a Twitter thread mention us with a keyword "unroll"
@threadreaderapp unroll

Practice here first or read more on our help page!

More from @kerpen

28 Feb
Burbio update:
% US K-12 students attending "virtual-only" schools = 27.5% (from 31.1% last week)
% US K-12 students attending "traditional" in-person/every day schools = 44.7%
% US K-12 students attending "hybrid" schools = 27.8%
K-5 Students:

23.7% attending virtual-only schools (from 26.4% last week)
22.1% attending schools offering hybrid (from 21.4%)
54.2% attending schools offering traditional (from 52.2%)
Grades 6-8 Students

29.0% attending virtual-only schools (from 34.6% last week)
32.2% attending schools offering hybrid (from 29.6%)
38.8% attending schools offering traditional (from 35.8%)
Read 7 tweets
26 Feb
Influenza update thread, MMWR Week 7
United States Influenza testing, MMWR week 7.

CDC flu view. cdc.gov/flu/weekly/ind…

Five-year average: 10,930 cases; 25.60% positive

Last year: 15,638; 30.58%

This year: 30; 0.10%

docs.google.com/spreadsheets/d…
United States Influenza testing, season to date (21 weeks, MMWR 40 to 7)

Five-year average: 124,156 cases; 16.45% positive

Last year: 205,675; 21.74%

This year: 1,701; 0.17%
Read 18 tweets
21 Feb
Cuomo keeps saying he only lied about WHERE people died. But he also still refuses to include probable deaths in the count -- and New York has a lot of them, because testing was scarce early.
This is the difference between the state dashboard that CTP uses and the count compiled from county sites used by Worldmeters. It's a huge difference.

As of today:

New York state dashboard: 37,851
County totals: 47,019
The CDC is closer to the county number because it has all the probables from NYC included. That's because the city reports separately, and De Blasio followed CDC directives to include probables.
Read 4 tweets
19 Feb
TWINDEMIC UPDATE THREAD MMWR WEEK 6

(Remember who said we'd skip flu season and who didn't!)
United States Influenza testing, MMWR week 6.

CDC flu view. cdc.gov/flu/weekly/ind…

Five-year average: 12,066 cases; 25.38% positive
Last year: 18,193; 31.96%
This year: 17; 0.04%

docs.google.com/spreadsheets/d…
United States Influenza testing, season to date (20 weeks, MMWR 40 to 6)

Five-year average: 109,042 cases; 15.57% positive
Last year: 183,066; 20.91%
This year: 1,585; 0.17%
Read 14 tweets
15 Feb
DC reports 1 death with COVID. Now 64 in February.

Positives / Tests %
1-Day: 83 / 3,084 2.69%
7-Day: 865 / 34,243 2.53%
14-Day: 1993 / 66,698 2.99%
28-Day: 4968 / 158,816 3.13%

Testing by week:
7-day total positives 865 - lowest since November 11.
Total COVID-19 Patients in DC Hospitals: 196
Total COVID-19 Patients in ICU: 46
Total Patients in DC Hospitals (COVID and non-COVID): 1,898
Read 7 tweets
14 Feb
Updated Burbio tracker!

% US K-12 students attending "virtual-only" schools = 33.6% (from 35.2% last week)
% US K-12 students attending "traditional" in-person/every day schools = 40.8%
% US K-12 students attending "hybrid" schools = 25.6%
Map of where schools are open vs. map of where Biden/CDC plan (everywhere red) recommends closed middle/high, force elementary hybrid and make all sports "virtual only." ImageImage
Burbio estimates that 93% of students currently attending full-time in-person schools are in Biden's red tier.
Read 5 tweets

Did Thread Reader help you today?

Support us! We are indie developers!


This site is made by just two indie developers on a laptop doing marketing, support and development! Read more about the story.

Become a Premium Member ($3/month or $30/year) and get exclusive features!

Become Premium

Too expensive? Make a small donation by buying us coffee ($5) or help with server cost ($10)

Donate via Paypal Become our Patreon

Thank you for your support!

Follow Us on Twitter!