
Friday Fluday Thread, MMWR Week 9
Please remember who told you we'd skip flu season and who screamed twindemic!
Please remember who told you we'd skip flu season and who screamed twindemic!
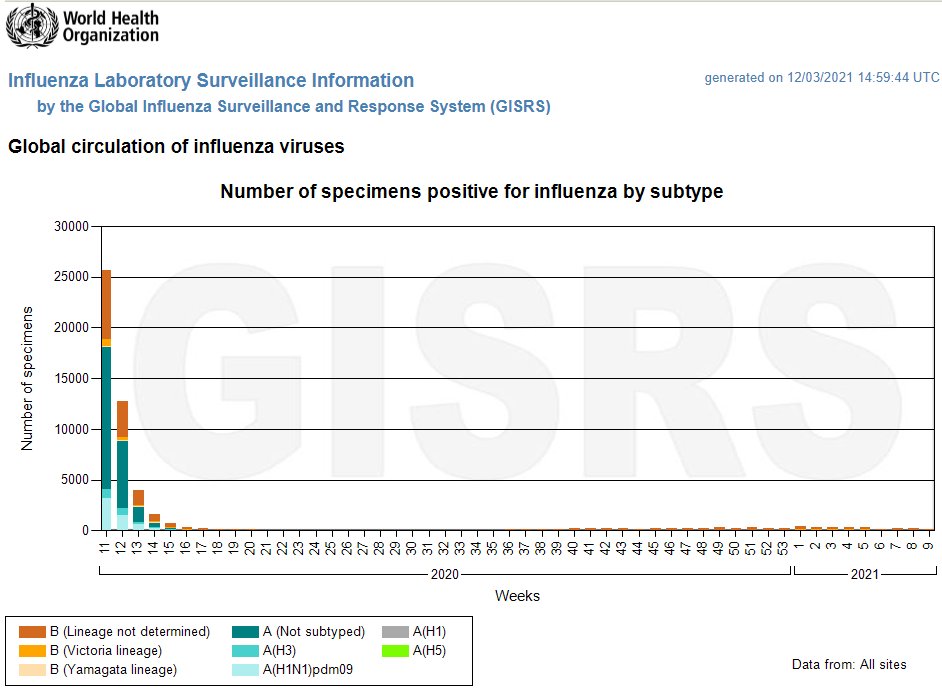
United States Influenza testing, MMWR week 9.
CDC flu view. cdc.gov/flu/weekly/ind…
Five-year average: 8,271 cases; 23.16% positive
Last year: 11,782; 25.57%
This year: 22; 0.08%
docs.google.com/spreadsheets/d…
CDC flu view. cdc.gov/flu/weekly/ind…
Five-year average: 8,271 cases; 23.16% positive
Last year: 11,782; 25.57%
This year: 22; 0.08%
docs.google.com/spreadsheets/d…

United States Influenza testing, season to date (23 weeks, MMWR 40 to 9)
Five-year average: 152,516 cases; 17.88% positive
Last year: 245,227; 22.71%
This year: 1,764; 0.17%
Five-year average: 152,516 cases; 17.88% positive
Last year: 245,227; 22.71%
This year: 1,764; 0.17%

Season-to-date U. S. flu hospitalizations down 98.8% from last year, which was a typical year.
Flu hospitalizations total (23 weeks) in FluSurv-NET catchment is 200. Through week 9 last year (22 weeks) it was 16,819.
Rate last year: 57.9 per 100K
This year: 0.7 per 100K
Flu hospitalizations total (23 weeks) in FluSurv-NET catchment is 200. Through week 9 last year (22 weeks) it was 16,819.
Rate last year: 57.9 per 100K
This year: 0.7 per 100K


Influenza-Like Illness (ILI) continues to track well lower than the mild 2015-16 and 2011-12 seasons, and is declining when it was rising in those years.

Still just one U.S. pediatric flu death this season. (There are 99 pediatric deaths with COVID this season.)

Influenza-Like Illness (ILI) Map
Week 9: 2021, 2020, 2019, 2018
Week 9: 2021, 2020, 2019, 2018


Latest U.S. non-SARS-CoV2 syndromic data from BioFire.
Lots of rhinoviruses and some adenoviruses all year.
HCoV-OC43 and HCoV-NL63 comeback continues as SARS-CoV2 recedes.
Flu A and RSV reappear.
syndromictrends.com/metric/panel/r…
Lots of rhinoviruses and some adenoviruses all year.
HCoV-OC43 and HCoV-NL63 comeback continues as SARS-CoV2 recedes.
Flu A and RSV reappear.
syndromictrends.com/metric/panel/r…


Florida. Schools open all year. No lockdowns since September. Rhinoviruses and some adenoviruses but nearly no flu. RSV returned in recent weeks and is rising toward normal levels.
floridahealth.gov/diseases-and-c…
floridahealth.gov/diseases-and-c…


Sweden week 9. No masks, no lockdowns, no school closures -- and nearly a full year with no Flu A, Flu B, or RSV. HCoVs have come back.
karolinska.se/globalassets/g…
karolinska.se/globalassets/g…


Brazil. Infamously lax control measures, and a president who urges people to disregard them.


I don't think it's masks, which have been shown to be ineffective for stopping influenza in many, many studies.

Japan masked hard in 2019 and failed to stop a major flu outbreak. But in 2020 flu disappeared with low stringency COVID intervention.
https://twitter.com/ianmSC/status/1365091758887997440
The idea mitigations worked but unmitigated SARS-CoV2 just has a higher R is way too facile.
Rhinoviruses bounced right back despite lower R and RSV was gone until recently with comparable R to SARS-CoV2.
HCoVs were gone until the last few weeks when SARS-CoV2 declined.
Rhinoviruses bounced right back despite lower R and RSV was gone until recently with comparable R to SARS-CoV2.
HCoVs were gone until the last few weeks when SARS-CoV2 declined.

Plus, as Biden adviser Dr. Michael Osterholm points out, our mitigation just hasn't been very effective. Maybe in places like Australia and New Zealand where mitigations stopped SARS-CoV2 they also stopped other viruses. But in countries where SARS-CoV2 went wild? No.

Osterholm: "There is this viral interference"
Viral interference is a well-known (but poorly understood) phenomenon. Interference from rhinovirus is generally thought to have ended the swine flu epidemic in 2009.
thelancet.com/journals/lanmi…
thelancet.com/journals/lanmi…
And H1N1 dominated other flu viruses that year -- a skipped seasonal flu season. No masks, lockdowns, or distancing needed.
https://twitter.com/Humble_Analysis/status/1365035607248969728
The bottom line is -- regardless of why we had the season we did -- we locked kids out of school during the safest respiratory season for children ever recorded. Shameful.
• • •
Missing some Tweet in this thread? You can try to
force a refresh


