Phil Kerpen Profile picture
14 Mar, 6 tweets, 2 min read
Weekly update from @BurbioCalendar:

% US K-12 students attending "virtual-only" schools = 20.8% (from 23.7% last week)

% US K-12 students attending "traditional" in-person/every day schools = 49.1% (from 46.9%)

% US K-12 students attending "hybrid" schools = 30.1% (from 29.4%)
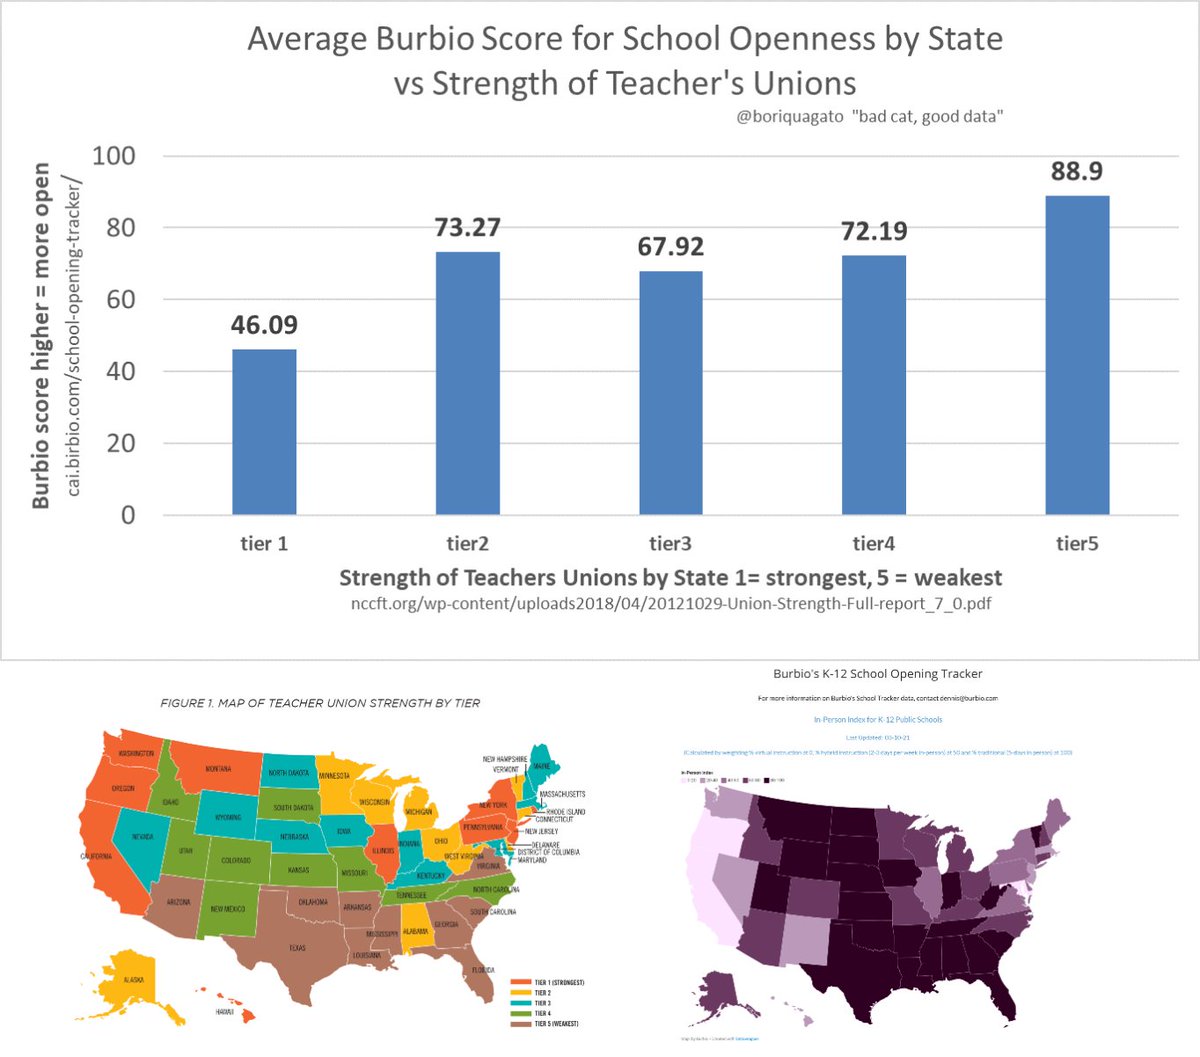
By state.

This "in-person index" is calculated by weighting the percentage of K-12 students in a state attending virtual schools at zero, traditional schools at 100, and hybrid districts at 50.
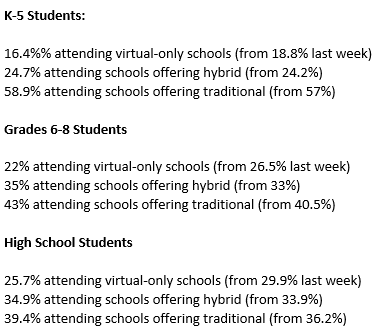
By grade level.
22 of the 26 states over 75% in-person have Republican governors.

19 of 24 under 75% and 8 of 10 under 50% have Democratic governors.
Some insight from the exiled elgatomalo:

gab.com/boriquagato/po…

• • •

Missing some Tweet in this thread? You can try to force a refresh
 

Keep Current with Phil Kerpen

Phil Kerpen Profile picture

Stay in touch and get notified when new unrolls are available from this author!

Read all threads

This Thread may be Removed Anytime!

PDF

Twitter may remove this content at anytime! Save it as PDF for later use!

Try unrolling a thread yourself!

how to unroll video
  1. Follow @ThreadReaderApp to mention us!

  2. From a Twitter thread mention us with a keyword "unroll"
@threadreaderapp unroll

Practice here first or read more on our help page!

More from @kerpen

12 Mar
Friday Fluday Thread, MMWR Week 9

Please remember who told you we'd skip flu season and who screamed twindemic!
United States Influenza testing, MMWR week 9.

CDC flu view. cdc.gov/flu/weekly/ind…

Five-year average: 8,271 cases; 23.16% positive

Last year: 11,782; 25.57%

This year: 22; 0.08%

docs.google.com/spreadsheets/d…
United States Influenza testing, season to date (23 weeks, MMWR 40 to 9)

Five-year average: 152,516 cases; 17.88% positive

Last year: 245,227; 22.71%

This year: 1,764; 0.17%
Read 22 tweets
7 Mar
Weekly update from @BurbioCalendar:

% US K-12 students attending "virtual-only" schools = 23.7% (from 27.5% last week)

% US K-12 students attending "traditional" in-person/every day schools = 46.9% (from 44.7%)

% US K-12 students attending "hybrid" schools = 29.4% (from 27.8%)
California passed Maryland for dead last.

cai.burbio.com/school-opening…
K-5 Students:

18.8% attending virtual-only schools (from 23.7% last week)

24.2% attending schools offering hybrid (from 22.1%)

57.0% attending schools offering traditional (from 54.2%)
Read 6 tweets
5 Mar
Friday Fluday Thread, MMWR Week 8

Friendly reminder: Please remember who told you we'd skip flu season and who screamed twindemic!
United States Influenza testing, MMWR week 8.

CDC flu view. cdc.gov/flu/weekly/ind…

Five-year average: 9,724 cases; 25.10% positive

Last year: 12,402; 27.95%

This year: 33; 0.09%

docs.google.com/spreadsheets/d…
United States Influenza testing, season to date (22 weeks, MMWR 40 to 8)

Five-year average: 139,610 cases; 17.31% positive

Last year: 225,169; 22.29%

This year: 1,739; 0.17%
Read 21 tweets
28 Feb
Burbio update:
% US K-12 students attending "virtual-only" schools = 27.5% (from 31.1% last week)
% US K-12 students attending "traditional" in-person/every day schools = 44.7%
% US K-12 students attending "hybrid" schools = 27.8%
K-5 Students:

23.7% attending virtual-only schools (from 26.4% last week)
22.1% attending schools offering hybrid (from 21.4%)
54.2% attending schools offering traditional (from 52.2%)
Grades 6-8 Students

29.0% attending virtual-only schools (from 34.6% last week)
32.2% attending schools offering hybrid (from 29.6%)
38.8% attending schools offering traditional (from 35.8%)
Read 7 tweets
26 Feb
Influenza update thread, MMWR Week 7
United States Influenza testing, MMWR week 7.

CDC flu view. cdc.gov/flu/weekly/ind…

Five-year average: 10,930 cases; 25.60% positive

Last year: 15,638; 30.58%

This year: 30; 0.10%

docs.google.com/spreadsheets/d…
United States Influenza testing, season to date (21 weeks, MMWR 40 to 7)

Five-year average: 124,156 cases; 16.45% positive

Last year: 205,675; 21.74%

This year: 1,701; 0.17%
Read 18 tweets
21 Feb
Cuomo keeps saying he only lied about WHERE people died. But he also still refuses to include probable deaths in the count -- and New York has a lot of them, because testing was scarce early.
This is the difference between the state dashboard that CTP uses and the count compiled from county sites used by Worldmeters. It's a huge difference.

As of today:

New York state dashboard: 37,851
County totals: 47,019
The CDC is closer to the county number because it has all the probables from NYC included. That's because the city reports separately, and De Blasio followed CDC directives to include probables.
Read 4 tweets

Did Thread Reader help you today?

Support us! We are indie developers!


This site is made by just two indie developers on a laptop doing marketing, support and development! Read more about the story.

Become a Premium Member ($3/month or $30/year) and get exclusive features!

Become Premium

Too expensive? Make a small donation by buying us coffee ($5) or help with server cost ($10)

Donate via Paypal Become our Patreon

Thank you for your support!

Follow Us on Twitter!