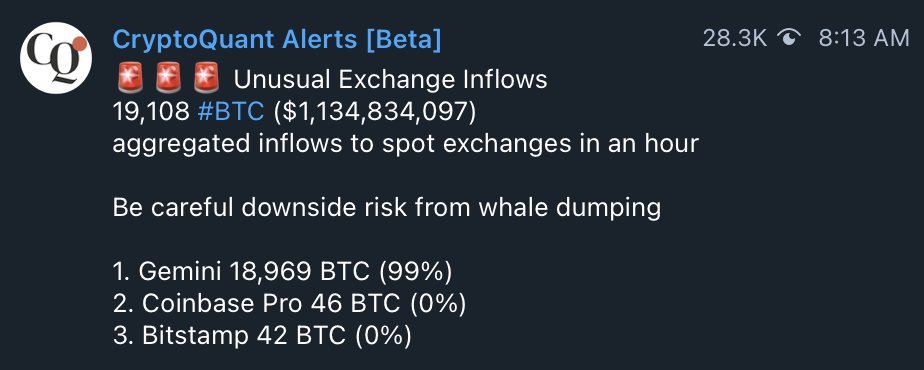
The @cryptoquant_com "data error" debate.
Did a whale send in 18k of BTC into Gemini to dump the markets? Or was it a data error?
This alert was sent out to 28,300 traders warning of whale dumping. Speculators sold off minutes later.
Did a whale send in 18k of BTC into Gemini to dump the markets? Or was it a data error?
This alert was sent out to 28,300 traders warning of whale dumping. Speculators sold off minutes later.
This chart shows Gemini prices vs the average of Coinbase and Binance.
When the warning was sent out to traders, Gemini price did not dip relative to others which is what dumping there would look like. In fact it rose indicating net purchasing on that exchange.
When the warning was sent out to traders, Gemini price did not dip relative to others which is what dumping there would look like. In fact it rose indicating net purchasing on that exchange.

Gemini trades $100m-$200m per day; that's insufficient liquidity to absorb a $1b sell. Price moves 2% on a $2m order there.
It makes no sense sell on Gemini.
Data: @coingecko
It makes no sense sell on Gemini.
Data: @coingecko

If the order was filled via their OTC desk, then we would expect to see corresponding flows go out to buyers on other desks/exchanges, this was NOT reported.
BTW, if this was an OTC transaction, it would be bullish due to $1b of price validation.
BTW, if this was an OTC transaction, it would be bullish due to $1b of price validation.
The underlying technical correctness of data presented by @cryptoquant_com really needs to be discussed by engineers in this field. Maybe @glassnode and @coinmetrics can comment. It's an issue with the accuracy of address labelling.
This is simply my fact checking analysis.
This is simply my fact checking analysis.
I looked at the txid cited by QC and clicked through to the wallet. This is the balance of the wallet claimed to be dumping into Gemini. It does not look like a whale holder dumping, more like an infrastructure entity like an exchange moving their coins.

https://twitter.com/cryptoquant_com/status/1371460828101189636?s=20

• • •
Missing some Tweet in this thread? You can try to
force a refresh


