IPCC AR5 WG3 (2014) had a figure showing the impact on mitigation costs of various technology restrictions (eg, no CCS).
It also compared lower energy demand (20–30% below baseline by 2050 & 35–45 % by 2100), first set of bars.
This 𝑟𝑒𝑑𝑢𝑐𝑒𝑑 mitigation costs by half.
1/
It also compared lower energy demand (20–30% below baseline by 2050 & 35–45 % by 2100), first set of bars.
This 𝑟𝑒𝑑𝑢𝑐𝑒𝑑 mitigation costs by half.
1/

The 'low energy demand' analysis enforced a reduction on demand, but did not evaluate the costs (ie, mitigation costs of reduced demand are assumed zero).
This is the same as in newer studies
* LED: nature.com/articles/s4156…
* Alternative pathways: nature.com/articles/s4155…
2/
This is the same as in newer studies
* LED: nature.com/articles/s4156…
* Alternative pathways: nature.com/articles/s4155…
2/
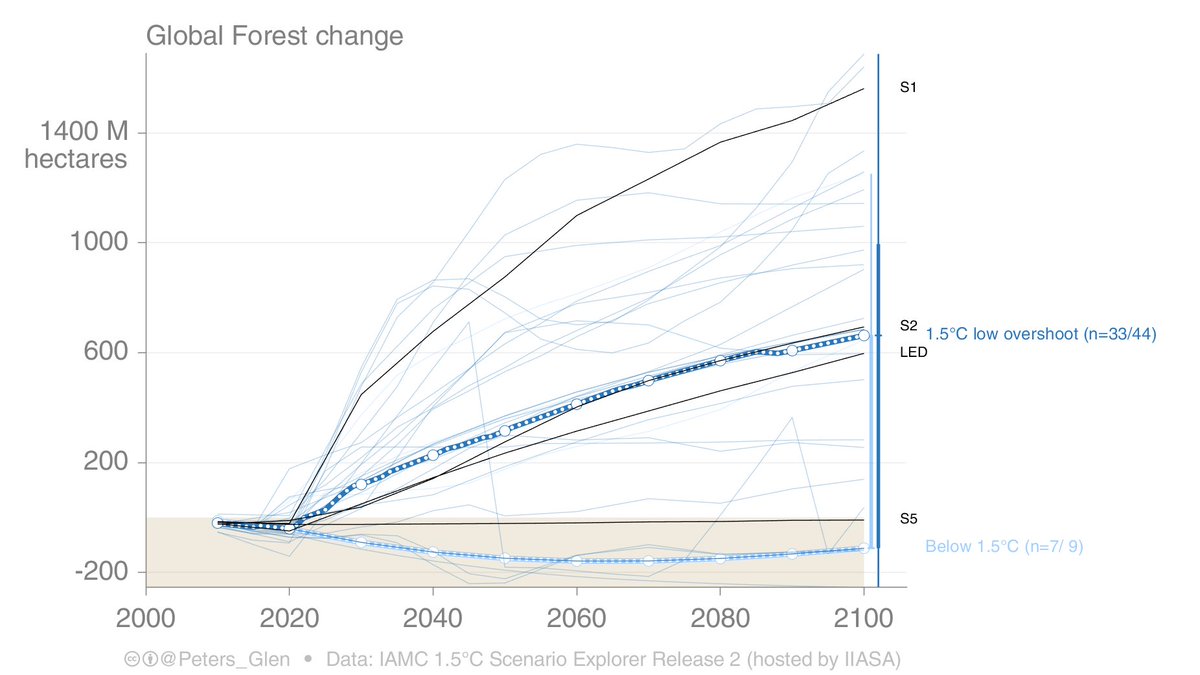
The (infamous) 'Low Energy Demand' scenario essentially combines two components, 'low energy demand' & 'no CCS'.
It also does really detailed analysis on the demand side, not just an arbitrary reduction (which is good).
nature.com/articles/s4156…
3/
It also does really detailed analysis on the demand side, not just an arbitrary reduction (which is good).
nature.com/articles/s4156…
3/

There are limits with cost analysis, as we all know, but the authors of LED are very clear that they are presenting a one-sided story.
We know that low energy demand reduces costs on the supply side (obviously), but we know little about how much demand reductions cost.
4/
We know that low energy demand reduces costs on the supply side (obviously), but we know little about how much demand reductions cost.
4/

This is the same in the other article I mentioned, though, note that the paper has a much longer discussion on the challenges with cost-optimal solutions in trading off supply-side and demand-side measures (read the paper for details).
nature.com/articles/s4155…
5/
nature.com/articles/s4155…
5/

I guess the standing assumption is that the cost of demand reductions will be low (just don't drive the car), though this may make rebounds higher (more money available)?
IAMs, at the moment, don't seem good at endogenising demand side reductions.
6/
IAMs, at the moment, don't seem good at endogenising demand side reductions.
6/
We can't deny there are also feasibility concerns with low energy demand scenarios as well.
Lower energy demand is obviously good, but that does not mean implementing it widespread is easy or that it is effective as in a model (rebounds hard to model).
7/
Lower energy demand is obviously good, but that does not mean implementing it widespread is easy or that it is effective as in a model (rebounds hard to model).
7/
Back to the IPCC figure.
LED is often sold as not requiring CCS (or BECCS).
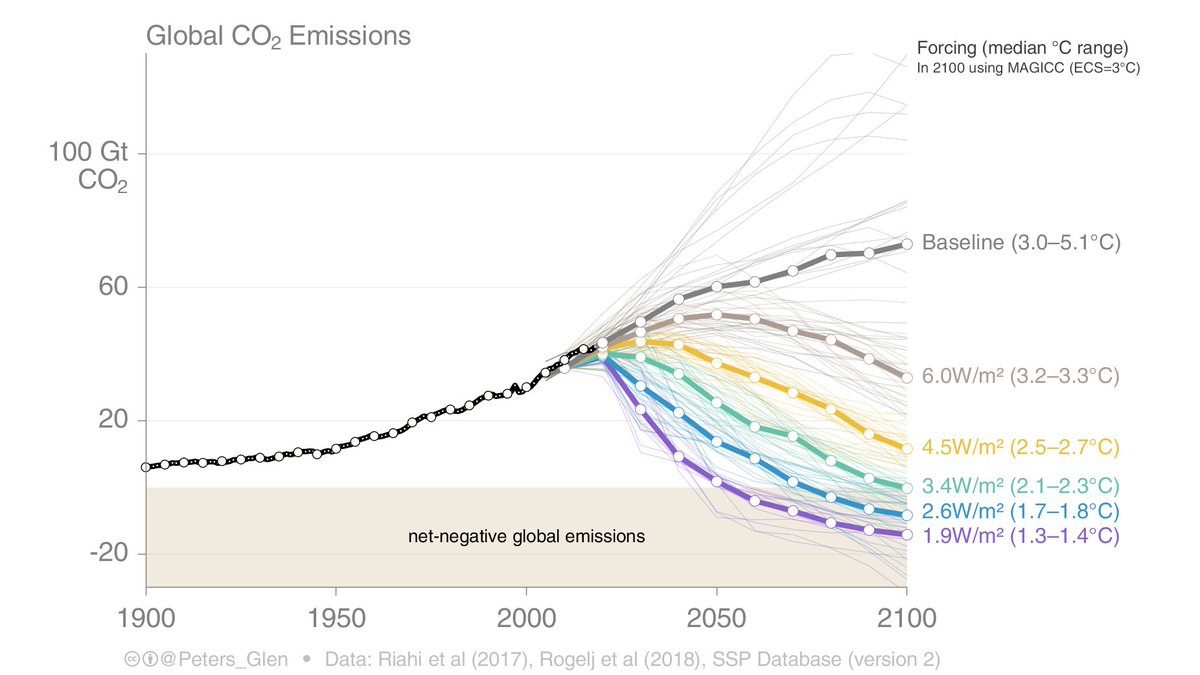
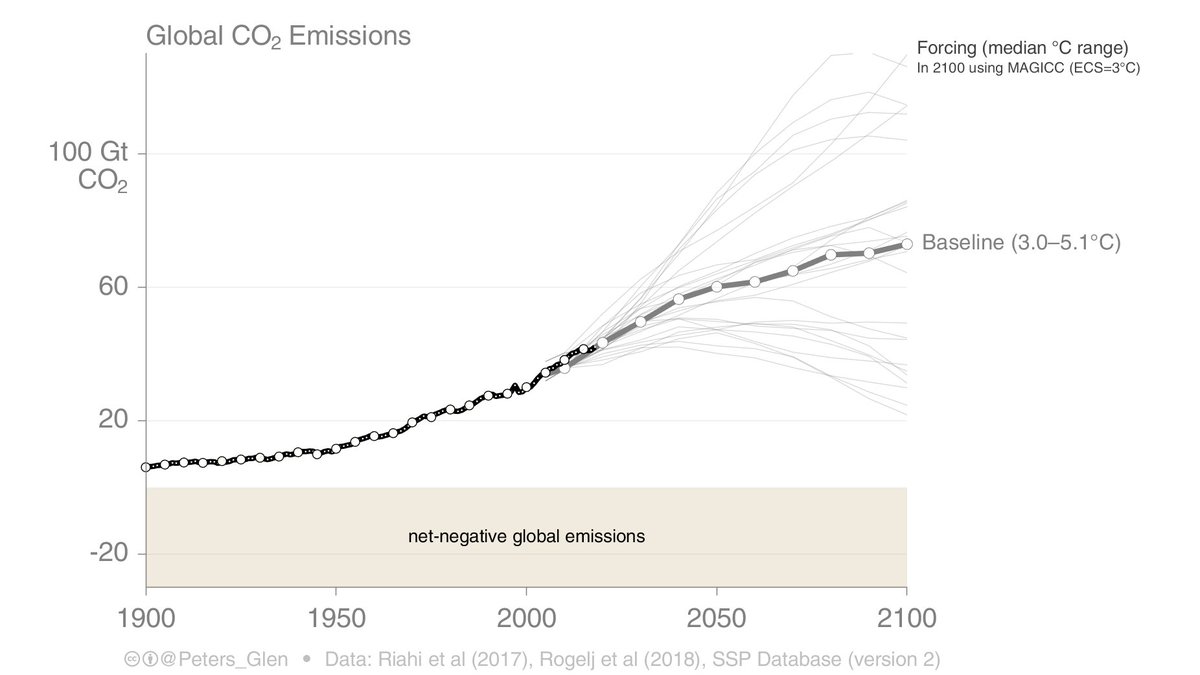
LED is essentially trading off low energy demand (reduced cost) & no CCS (higher cost). In this figure, they would roughly cancel (0.5*2=1), noting costs of demand reduction not included.
8/
LED is often sold as not requiring CCS (or BECCS).
LED is essentially trading off low energy demand (reduced cost) & no CCS (higher cost). In this figure, they would roughly cancel (0.5*2=1), noting costs of demand reduction not included.
8/

LED is a great scenario with a really detailed analysis of the demand side (hats off).
The choice to avoid CCS was to make a point (& probably stir) the IAM community with their scenarios dominated by large-scale CCS (& BECCS).
9/
The choice to avoid CCS was to make a point (& probably stir) the IAM community with their scenarios dominated by large-scale CCS (& BECCS).
9/
This long thread is to make the point that we should praise the work on LED for energy demand analysis & setting a new standard.
The CCS, BECCS, & CDR issue is different & was an unnecessary restriction to apply in LED. We don't have to have either / or.
10/10
The CCS, BECCS, & CDR issue is different & was an unnecessary restriction to apply in LED. We don't have to have either / or.
10/10
• • •
Missing some Tweet in this thread? You can try to
force a refresh


