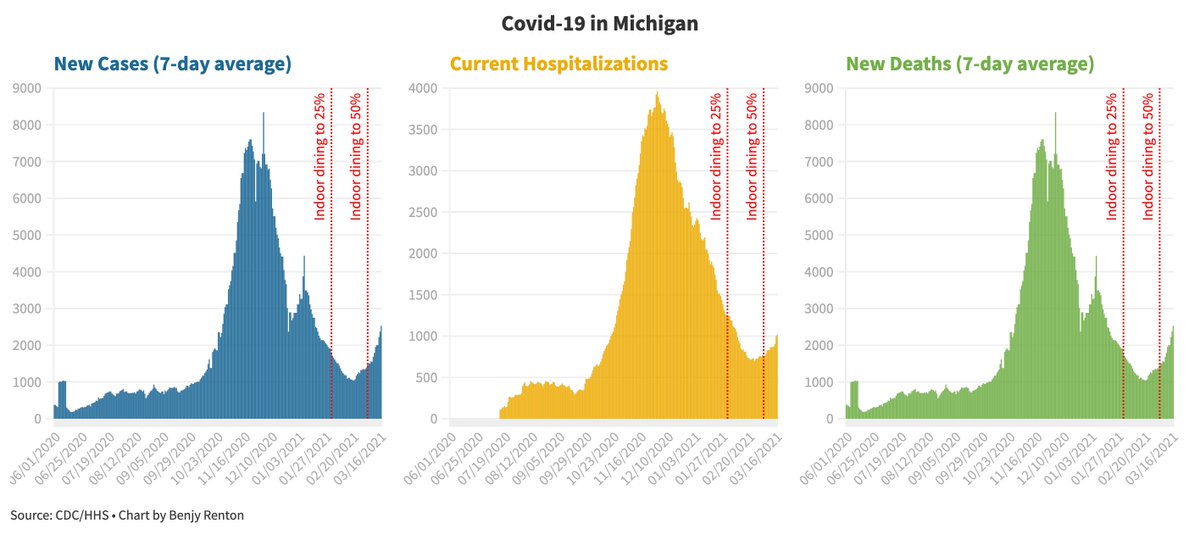
It ain't over till it's over. While cases throughout much of the country have continued to decline, Michigan has seen an increase in new cases and hospitalizations. This could point to the effects of variants in a largely unvaccinated population. Thread:
covidtracking.com/analysis-updat…
First, let's show how we got here. The increase in cases may be attributed to not only pandemic fatigue, but also policy that opened indoor dining to 25% (February 1) and 50% capacity (March 5). This was after largely successful policy in November.
Enter variants. The B.1.1.7 variant has been increasing in prevalence in Michigan, now estimated to be 60% of cases — higher than Florida, according to Helix data (graphic credit @EricTopol). Michigan may be the bellwether state on this variant.
helix.com/pages/helix-co…
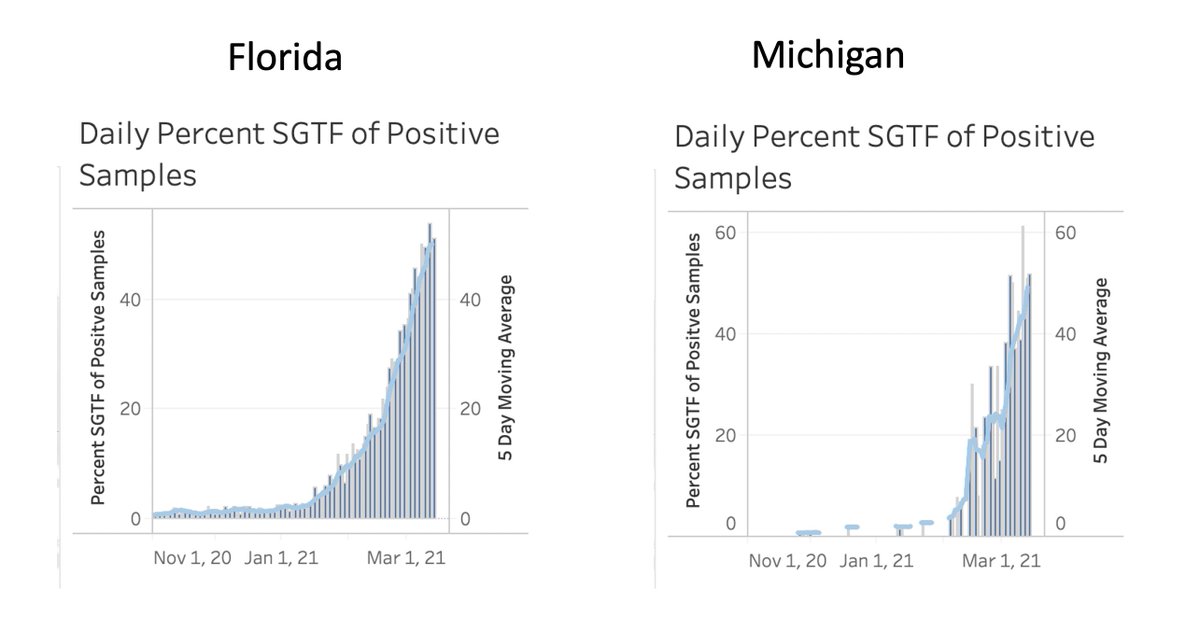
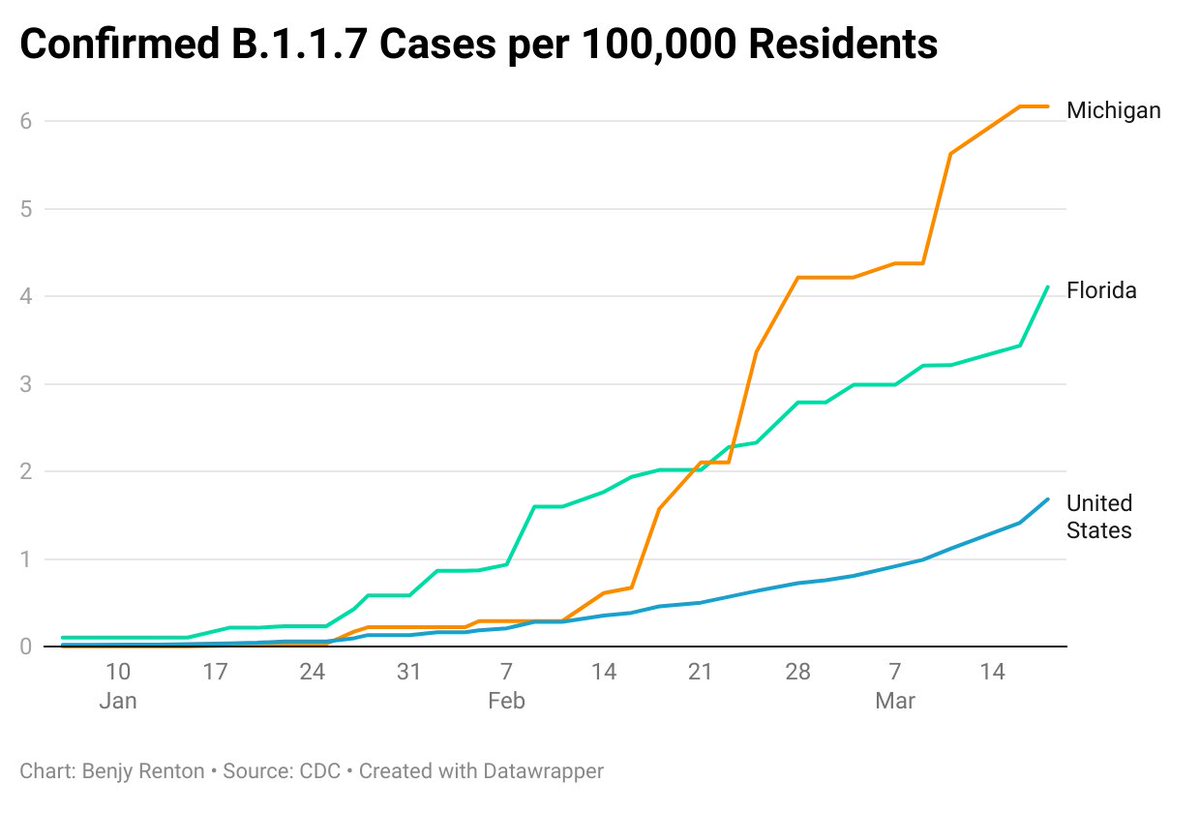
According to sequencing data from the CDC, Michigan has the highest number of confirmed B.1.1.7 cases per capita.
It has quickly eclipsed the national average and even that of Florida.
You may also remember that this variant was spreading on the University of Michigan's campus in mid-February.
michigandaily.com/section/news-b…
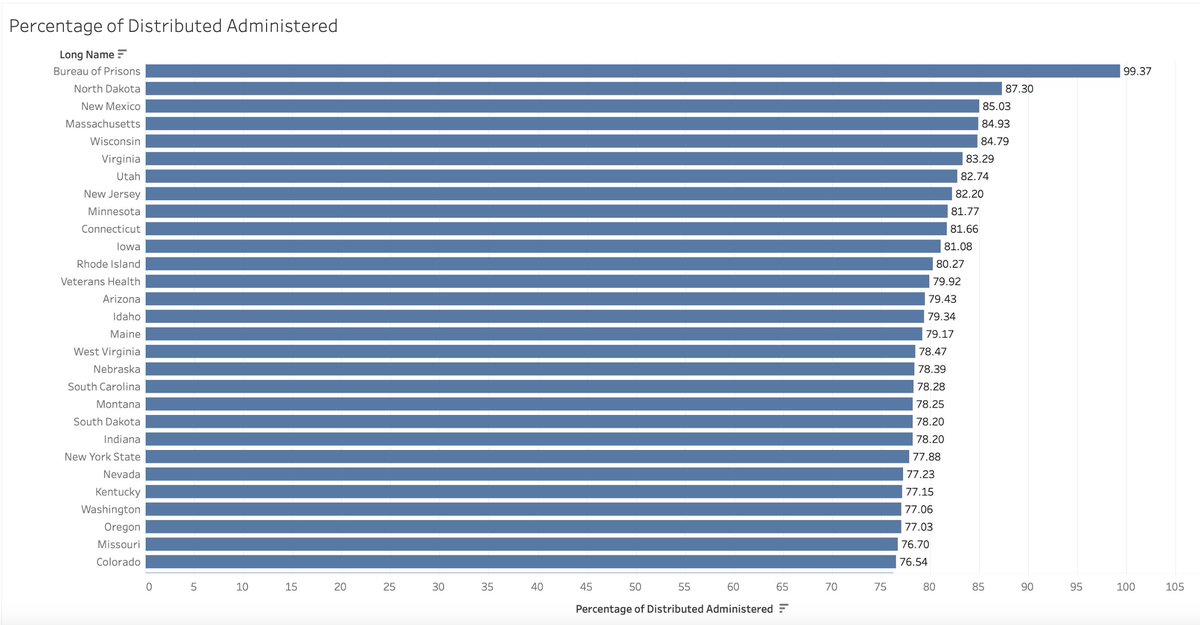
We knew the variants were going to spread. The issue is Michigan's pace of vaccinations is much lower than any other states, and the variant will continue to spread in Detroit and move to more rural areas. Here is how Michigan compared to neighboring states on vaccination.
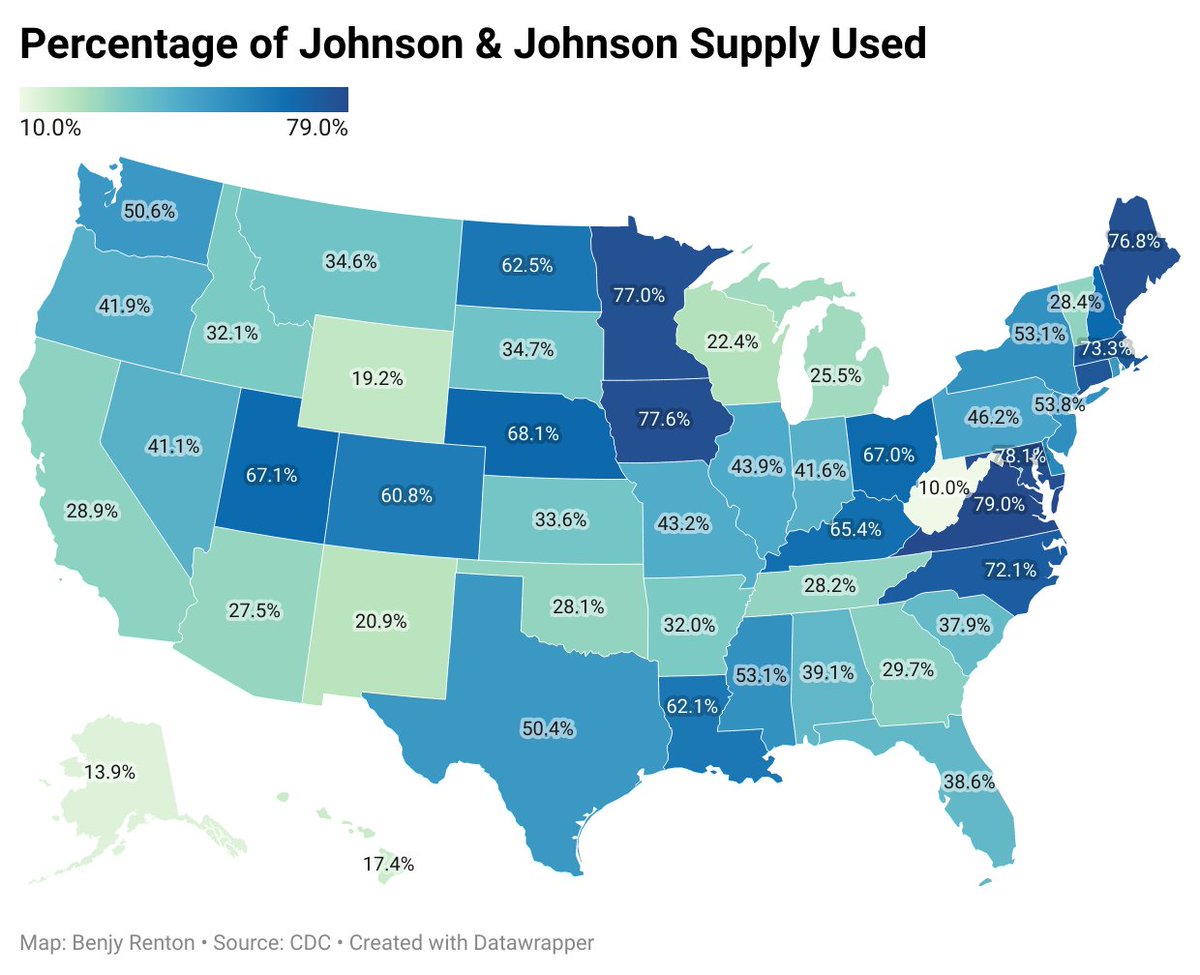
The latest CDC data also show that Michigan has been slow to deploy the Johnson & Johnson vaccine, though these numbers may be affected by a reporting lag.
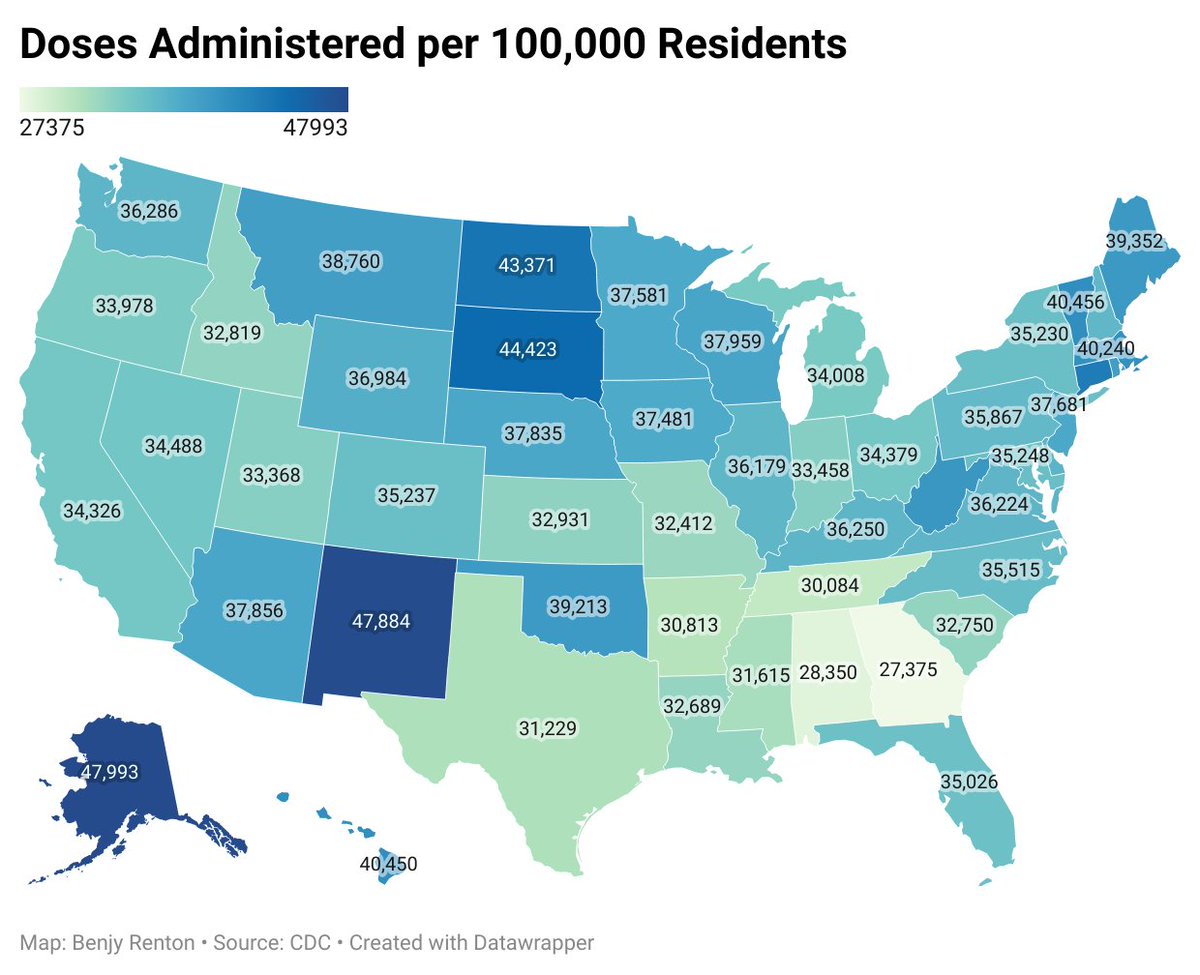
When it comes to vaccinations, Michigan ranks:
- 37th in doses administered per capita
- 34th in the percentage of the population with at least 1 dose
- 32nd in the percentage of the population fully vaccinated
- 28th in 65+ with at least 1 dose (most vulnerable)
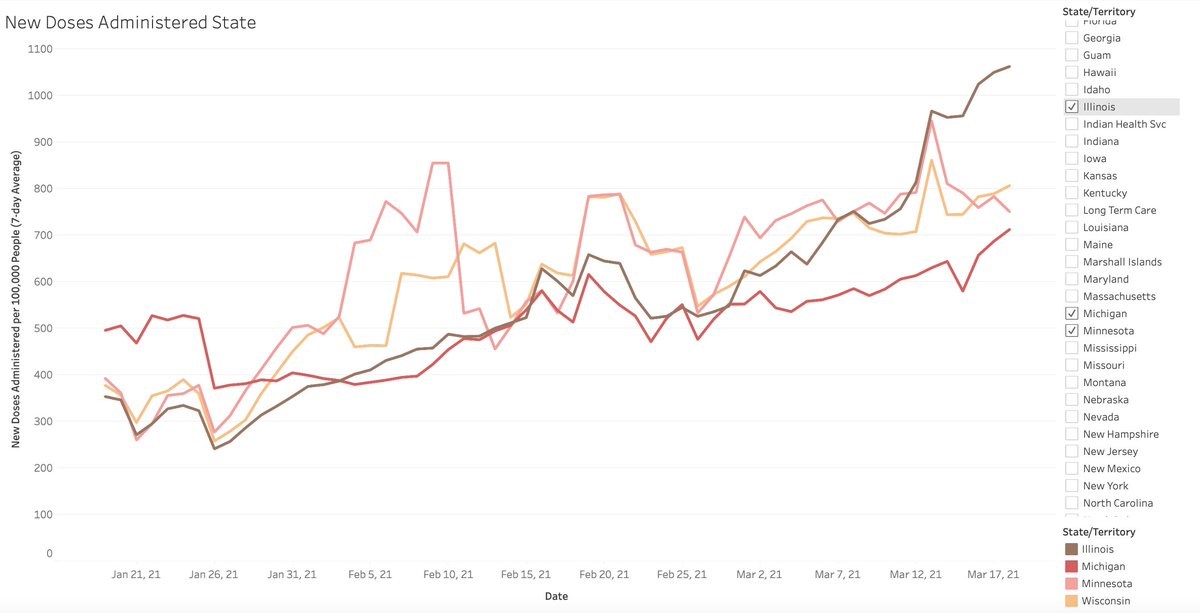
Additionally, Michigan's daily pace of vaccination (red) continues to lag behind other neighboring states, such as Illinois (brown), Minnesota (pink) and Wisconsin (yellow).
It is great that Michigan has opened Ford Field as a federally-supported mass vaccination site and will open vaccinations to all adults on April 5. However, between now and then, the state should focus on accelerating vaccinations. Every shot counts.
theatlantic.com/health/archive…
As @ashishkjha notes, national data often misses underlying state trends, and an outbreak in Michigan will quickly become a regional one without mitigation. Now is not the time to be relaxing measures — we need to continue vaccinating the most vulnerable.
One final note: Thanks to Michigan's Department of Health and Human Services for providing such a detailed vaccine dashboard.
michigan.gov/coronavirus/0,…
Another final note: A recent U.S. Census Bureau survey showed that Michigan had vaccine enthusiasm rates that were in the middle of the pack when compared to other states. Emphasis must be placed on encouraging vaccine uptake and reaching vulnerable populations.

• • •

Missing some Tweet in this thread? You can try to force a refresh
 

Keep Current with Benjy Renton

Benjy Renton Profile picture

Stay in touch and get notified when new unrolls are available from this author!

Read all threads

This Thread may be Removed Anytime!

PDF

Twitter may remove this content at anytime! Save it as PDF for later use!

Try unrolling a thread yourself!

how to unroll video
  1. Follow @ThreadReaderApp to mention us!

  2. From a Twitter thread mention us with a keyword "unroll"
@threadreaderapp unroll

Practice here first or read more on our help page!

More from @bhrenton

14 Mar
Vaccine data reporting 101:

The CDC pulls numbers from state immunization sites every morning at 6 a.m. (the daily cutoff). It spends the morning verifying these numbers and publishes a public update by 8 p.m. (usually some time in the afternoon).
Today, the CDC reported 2,977,732 doses by the 6 a.m. cutoff (a record regardless) and then had a delay in data syncing, resulting in 4,575,496 new doses administered that were reported. This means tomorrow's numbers will be slightly lower than usual.
As per usual, doses are reported two ways: by the day they are reported (right) and the day they are actually administered (left). The graph on the left is backfilled each day as states report more doses. However, we often use the graph on the right for daily vaccinations.
Read 5 tweets
13 Mar
Earlier this week, Alaska made vaccines available to those 16 and older, becoming the first state to remove eligibility requirements. It leads the nation with 17% of its population fully vaccinated. So what can we learn? And what is it sometimes hard to compare states? A thread:
While Alaska is the first state to remove eligibility requirements, effective immediately, other states are expected to do the same in the coming weeks, and certainly before President Biden's deadline on May 1. We will continue to track these.
washingtonpost.com/health/2021/03…
Vaccination plans are complex and in order to make comparisons among states with metrics such as doses per capita and percentage of the population vaccinated, we must consider:
- Supply
- Delivery
- Uptake
- Population characteristics

Let's analyze Alaska with these factors.
Read 13 tweets
10 Mar
2,028,692 doses have been reported administered in the last 24 hours, according to the CDC. 24.4% of adults have received a first dose.

Doses Delivered: 127,869,155
Doses Administered: 95,721,290

74.9% of delivered doses have been administered.
public.tableau.com/views/COVID-19… Image
North Dakota leads the nation with 87.3% of shots used. The percentage of supply used is merely one metric to compare states, and soon the dashboard will have more metrics for you to use. The 7-day average is now 2.17 million doses per day. Image
15.7 million doses of Pfizer and Moderna doses have been allocated for jurisdictions next week. The dashboard has been updated with the latest allocations.
Read 4 tweets
10 Mar
It's important to note that each state has different population characteristics that could affect the speed of its vaccination rollout. For example 7.5% of residents in Alaska are over the age of 70, compared to 13.4% in Vermont. State governments often know what is best.
This is not necessarily endorsing a particular state's strategy. Rather, it is stating the fact that states are allocated doses based on its general adult population, not according to each state's individual strategy. States using an aged-based system may take…
…longer to move through age bands, particularly if the average age is older than other states. Additionally, vaccine uptake plays a huge role — some states have ensured high uptake in each group before moving on to the next one.
Read 4 tweets
20 Feb
1,847,276 doses have been reported administered in the last 24 hours, according to the CDC. All states reported doses delivered and administered.

Doses Delivered: 78,152,495
Doses Administered: 59,585,043

76.2% of delivered doses have been administered.
public.tableau.com/views/COVID-19…
Will post more data in the coming days detailing how severe weather is affecting vaccine deliveries, as the White House announced today 6 million doses are backlogged and will be shipped very shortly. Deliveries and reporting systems are recovering — look at the green uptick.
North Dakota now leads the nation with 95% of shots used. This number will drop for all states as supply is replenished.
Read 4 tweets
19 Feb
Just over 21,000 vaccine doses were reported administered in Texas in the last 24 hours, the latest in a series of fallbacks after severe weather has disrupted vaccination sites and reporting systems. The number of doses allocated to the state has not changed in 3 days. Image
In the last 24 hours, 46% of counties reported fewer than 10 doses administered. Compared with last Thursday, almost all counties are reporting fewer new doses administered by a large margin. It may take days for the infrastructure to recover and reporting to catch up. Image
"Any delays, the timing could not be worse," @PeterHotez said on @CNNTonight last night.
Read 4 tweets

Did Thread Reader help you today?

Support us! We are indie developers!


This site is made by just two indie developers on a laptop doing marketing, support and development! Read more about the story.

Become a Premium Member ($3/month or $30/year) and get exclusive features!

Become Premium

Too expensive? Make a small donation by buying us coffee ($5) or help with server cost ($10)

Donate via Paypal Become our Patreon

Thank you for your support!

Follow Us on Twitter!