#CaseStudies #IPOBase #Shankara
As mentioned, here is my next study on #IPOBases on Shankara Building Products. The public offer for Shankara opened on 22nd March, 2017 & closed on 24th March, 2017. It saw good response in public offer, got subscribed 41.88 times and got (1/n)
As mentioned, here is my next study on #IPOBases on Shankara Building Products. The public offer for Shankara opened on 22nd March, 2017 & closed on 24th March, 2017. It saw good response in public offer, got subscribed 41.88 times and got (1/n)
https://twitter.com/swing_ka_sultan/status/1372743655052648454
listed at 18% premium on 5th April, 2017.
Post listing what the stock made, we can call it a model IPO Base. It just can't be any better. The stock rose for 5 days post listing, signifying good demand before forming its left side high of the base. For 2 weeks we saw a (2/n)
Post listing what the stock made, we can call it a model IPO Base. It just can't be any better. The stock rose for 5 days post listing, signifying good demand before forming its left side high of the base. For 2 weeks we saw a (2/n)

little pullback, after which the stock starts carving its bottom. Continuous 6 weeks tight closing, something which can't be more constructive for an IPO base.
Lets see this in daily. There are 3 entries available here - 2 as cheat & one at standard breakout level. (3/n)
Lets see this in daily. There are 3 entries available here - 2 as cheat & one at standard breakout level. (3/n)

In such situation, I will usually prefer to buy at both cheat areas, and let go the standard breakout. Why? Because the stock is directly coming out from the bottom of the base. But here we will follow our rule to reduce discretion as much as possible. Hence I will buy at (4/n)
1st cheat area, with a very narrow SL of just 4.7% & at standard IPO base breakout with 8% wide distance based SL. We have 2 open positions here.
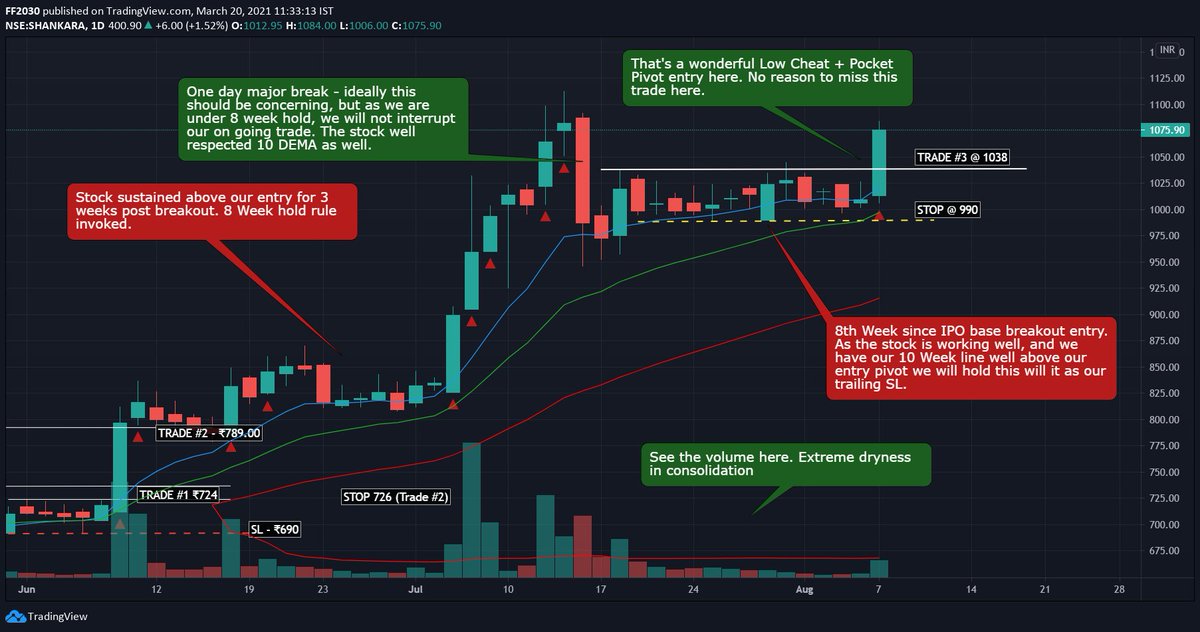
The stock moved up well and our 8 week rule invoked in the 4th week of June, 2017. (5/n)
The stock moved up well and our 8 week rule invoked in the 4th week of June, 2017. (5/n)

The stock gave a major break on 17 June post several days of strong up move, but as we are in 8 week hold, we will avoid micro managing the trade here.
Later the stock forms a wonderful low cheat setup where we will plan our 3rd entry. It triggered on 7th August, 2017 at (6/n)
Later the stock forms a wonderful low cheat setup where we will plan our 3rd entry. It triggered on 7th August, 2017 at (6/n)

₹1038 with SL of 4.62% at 990.
The stock came back to take out our SL in just 3 days after entry. What we missed here? We missed that we had quarterly earnings report pending for 09th August, hence we should have avoided the trade before that. (7/n)
The stock came back to take out our SL in just 3 days after entry. What we missed here? We missed that we had quarterly earnings report pending for 09th August, hence we should have avoided the trade before that. (7/n)

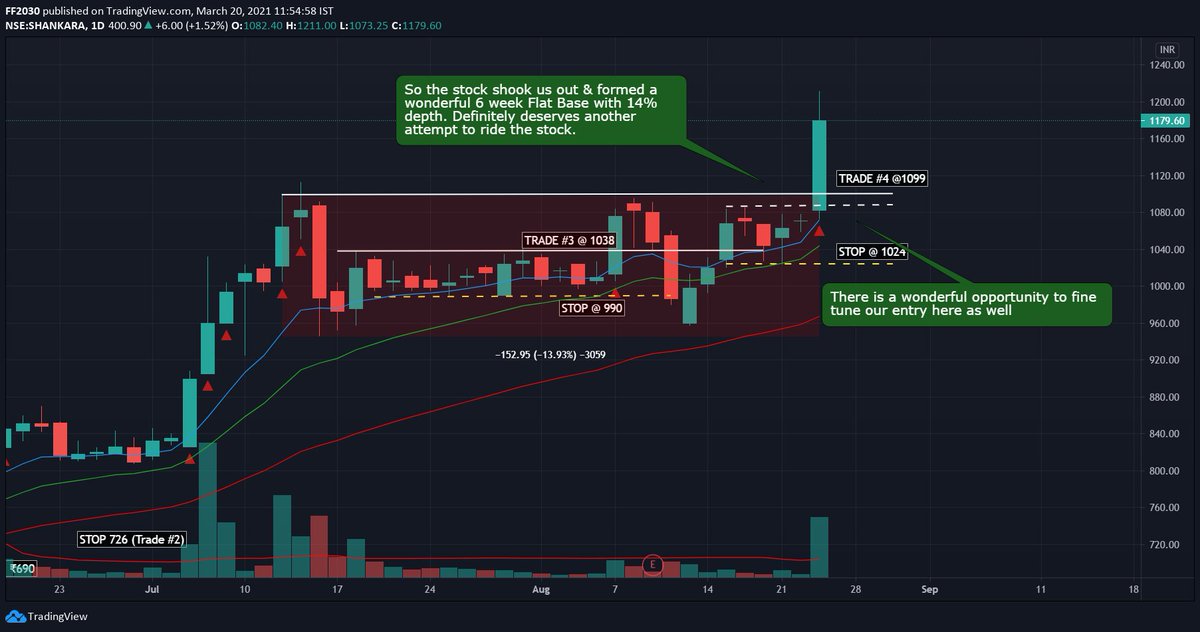
Post shaking us out from the trade, Shankara forms a 6 week long Flat Base with 14% depth. We are seeing little volatility contraction as well at the later stage of the base, which is adding to our comfort. Hence we will plan our 4th trade here. Keep in mind, both our (8/n) 

prior entries are risk free, hence we need not to take any additional risk, instead we can use the in house profit to initiate the trade.
Our trade triggered on 23rd August, 2017 at 1099 with SL at 1024 which is 6.82% deep. (9/n)
Our trade triggered on 23rd August, 2017 at 1099 with SL at 1024 which is 6.82% deep. (9/n)
The stock moved up very well post breakout, and sooner our trade become risk free. As both our prior positions are trailed by 50 day moving average, we will trail this as well by the same.
Meanwhile, we are getting another opportunity here, but already having 3 positions (10/n)
Meanwhile, we are getting another opportunity here, but already having 3 positions (10/n)

and the setup too doesn't looks very proper, we will avoid the trade here. The breakout didn't sustained and fell back into basing, which is a little high from prior basing. In the second base, stock breaks 20 DEMA and wasn't looking very promising, despite that we will (11/n) 

hold our position with our TSL.
That ended up been a shakeout, and stock resets again, formed a wonderful Flat Base with significant volatility reduction, offering us another trade opportunity. We had a range contraction here, and the stock is also not extended from your (12/n)
That ended up been a shakeout, and stock resets again, formed a wonderful Flat Base with significant volatility reduction, offering us another trade opportunity. We had a range contraction here, and the stock is also not extended from your (12/n)

10 week line.
Lets see in daily. The stock is clearly offering a wonderful trade which we took at ₹1538 on 23rd Nov 2017. This is our 4th open position in the stock, though all prior positions are totally risk free. Our SL will be at 1440 which is 6.37% away from entry.(13/n)
Lets see in daily. The stock is clearly offering a wonderful trade which we took at ₹1538 on 23rd Nov 2017. This is our 4th open position in the stock, though all prior positions are totally risk free. Our SL will be at 1440 which is 6.37% away from entry.(13/n)

Stock moved up well, but a change in behavior is easily visible. The move is accelerating on upside with huge volume. This is an ideal situation to plan our exit or at least reduction in allocation. (14/n) 

And after showing little hesitation in moving further up despite huge volume, the stock gave the biggest break since listing, declining 15% on biggest volume in one day. This is sufficient reason to exit and hence we will close both our follow up trades at 1911 (closing) (15/n) 

while holding the initial quantity with trailing SL at 50 day moving average.
And the stock gave a decisive breakdown below 50EMA on 25th Jan, 2018, forcing us close our remaining trades. (16/n)
And the stock gave a decisive breakdown below 50EMA on 25th Jan, 2018, forcing us close our remaining trades. (16/n)

Net proceeds from the trade-
Trade #1 Return +134.81% R +28.71
Trade #2 Return +115.46% R +14.46
Trade #3 Return - 4.62% R -1
Trade #4 Return +73.89% R +10.83
Trade #5 Return +24.25% R +3.81
Total Return +344%, R +56.80!
Yes, 56 R! Think over what we would have done if (17/n)
Trade #1 Return +134.81% R +28.71
Trade #2 Return +115.46% R +14.46
Trade #3 Return - 4.62% R -1
Trade #4 Return +73.89% R +10.83
Trade #5 Return +24.25% R +3.81
Total Return +344%, R +56.80!
Yes, 56 R! Think over what we would have done if (17/n)
we would have sold all position in the climactic action itself!
Another interesting fact, our both initial entries are taken on same day, but the difference in outcome is huge. Our standard breakout made just half of what our first cheat entry had made in terms of R! (18/n)
Another interesting fact, our both initial entries are taken on same day, but the difference in outcome is huge. Our standard breakout made just half of what our first cheat entry had made in terms of R! (18/n)
I hope this second #CaseStudy had given you a lot of insights not only on the #IPOBase, but about trade management, adding up and selling into weakness as well.
Show your love if you liked it! It matters! It will inspire me to share more such studies in future as well! (19/n)
Show your love if you liked it! It matters! It will inspire me to share more such studies in future as well! (19/n)
@mwebster1971, @IBD_Irusha, @IBDinvestors @TraderLion_ @RichardMoglen @BlogJulianKomar @canslim_
Guys, have a look. Let me know how I can improve! And also help it get a little more reach! Thank You! (20/20)
Guys, have a look. Let me know how I can improve! And also help it get a little more reach! Thank You! (20/20)
• • •
Missing some Tweet in this thread? You can try to
force a refresh


